¶ Metrics, Monitoring, and Alerting
Metrics, monitoring, and alerting are all interrelated concepts that together form the basis of a monitoring system. They have the ability to provide visibility into the health of your systems, help you understand trends in usage or behavior, and to understand the impact of changes you make. If the metrics fall outside of your expected ranges, these systems can send notifications to prompt an operator to take a look, and can then assist in surfacing information to help identify the possible causes.
We use ELK stack, Hearbeat, APM, Azure monitor, Grafana and MS Teams to achieve great monitoring and alerting system. At last we also use our ticketing system where automatic tickets at freshdesk are generated if something needs to be fixed by our dev team.
¶ Metrics
We collect all possible and required metrics for AKS environment which helps to keep lot of things under monitoring. We collects metrics at several levels.
¶ Host-Based Metrics
- CPU
- Memory
- Disk space
- Processes
We monitor above metrics for every virtual machine in AKS and all the instances running on those instances.
¶ Application Metrics
- Error and success rates
- Service failures and restarts
- Performance and latency of responses
- Resource usage
This is collected at application and application module levels using different tools like hearbeat, APM etc
¶ Network and Connectivity Metrics
- Connectivity
- Error rates and packet loss
- Latency
- Bandwidth utilization
All the above metrics are collected at virtual machine level.
¶ Database Server Pool Metrics
- Pooled resource usage
- Scaling adjustment indicators
- Degraded instances
These metrics are collected for database server pools to monitor its usage and patterns
¶ Monitoring
We use Grafana as monitoring and visualisation tool. Here we proces all the metrics collected to a visual dashboard for analysis and reporting.
Few highlights from our visual dashboard
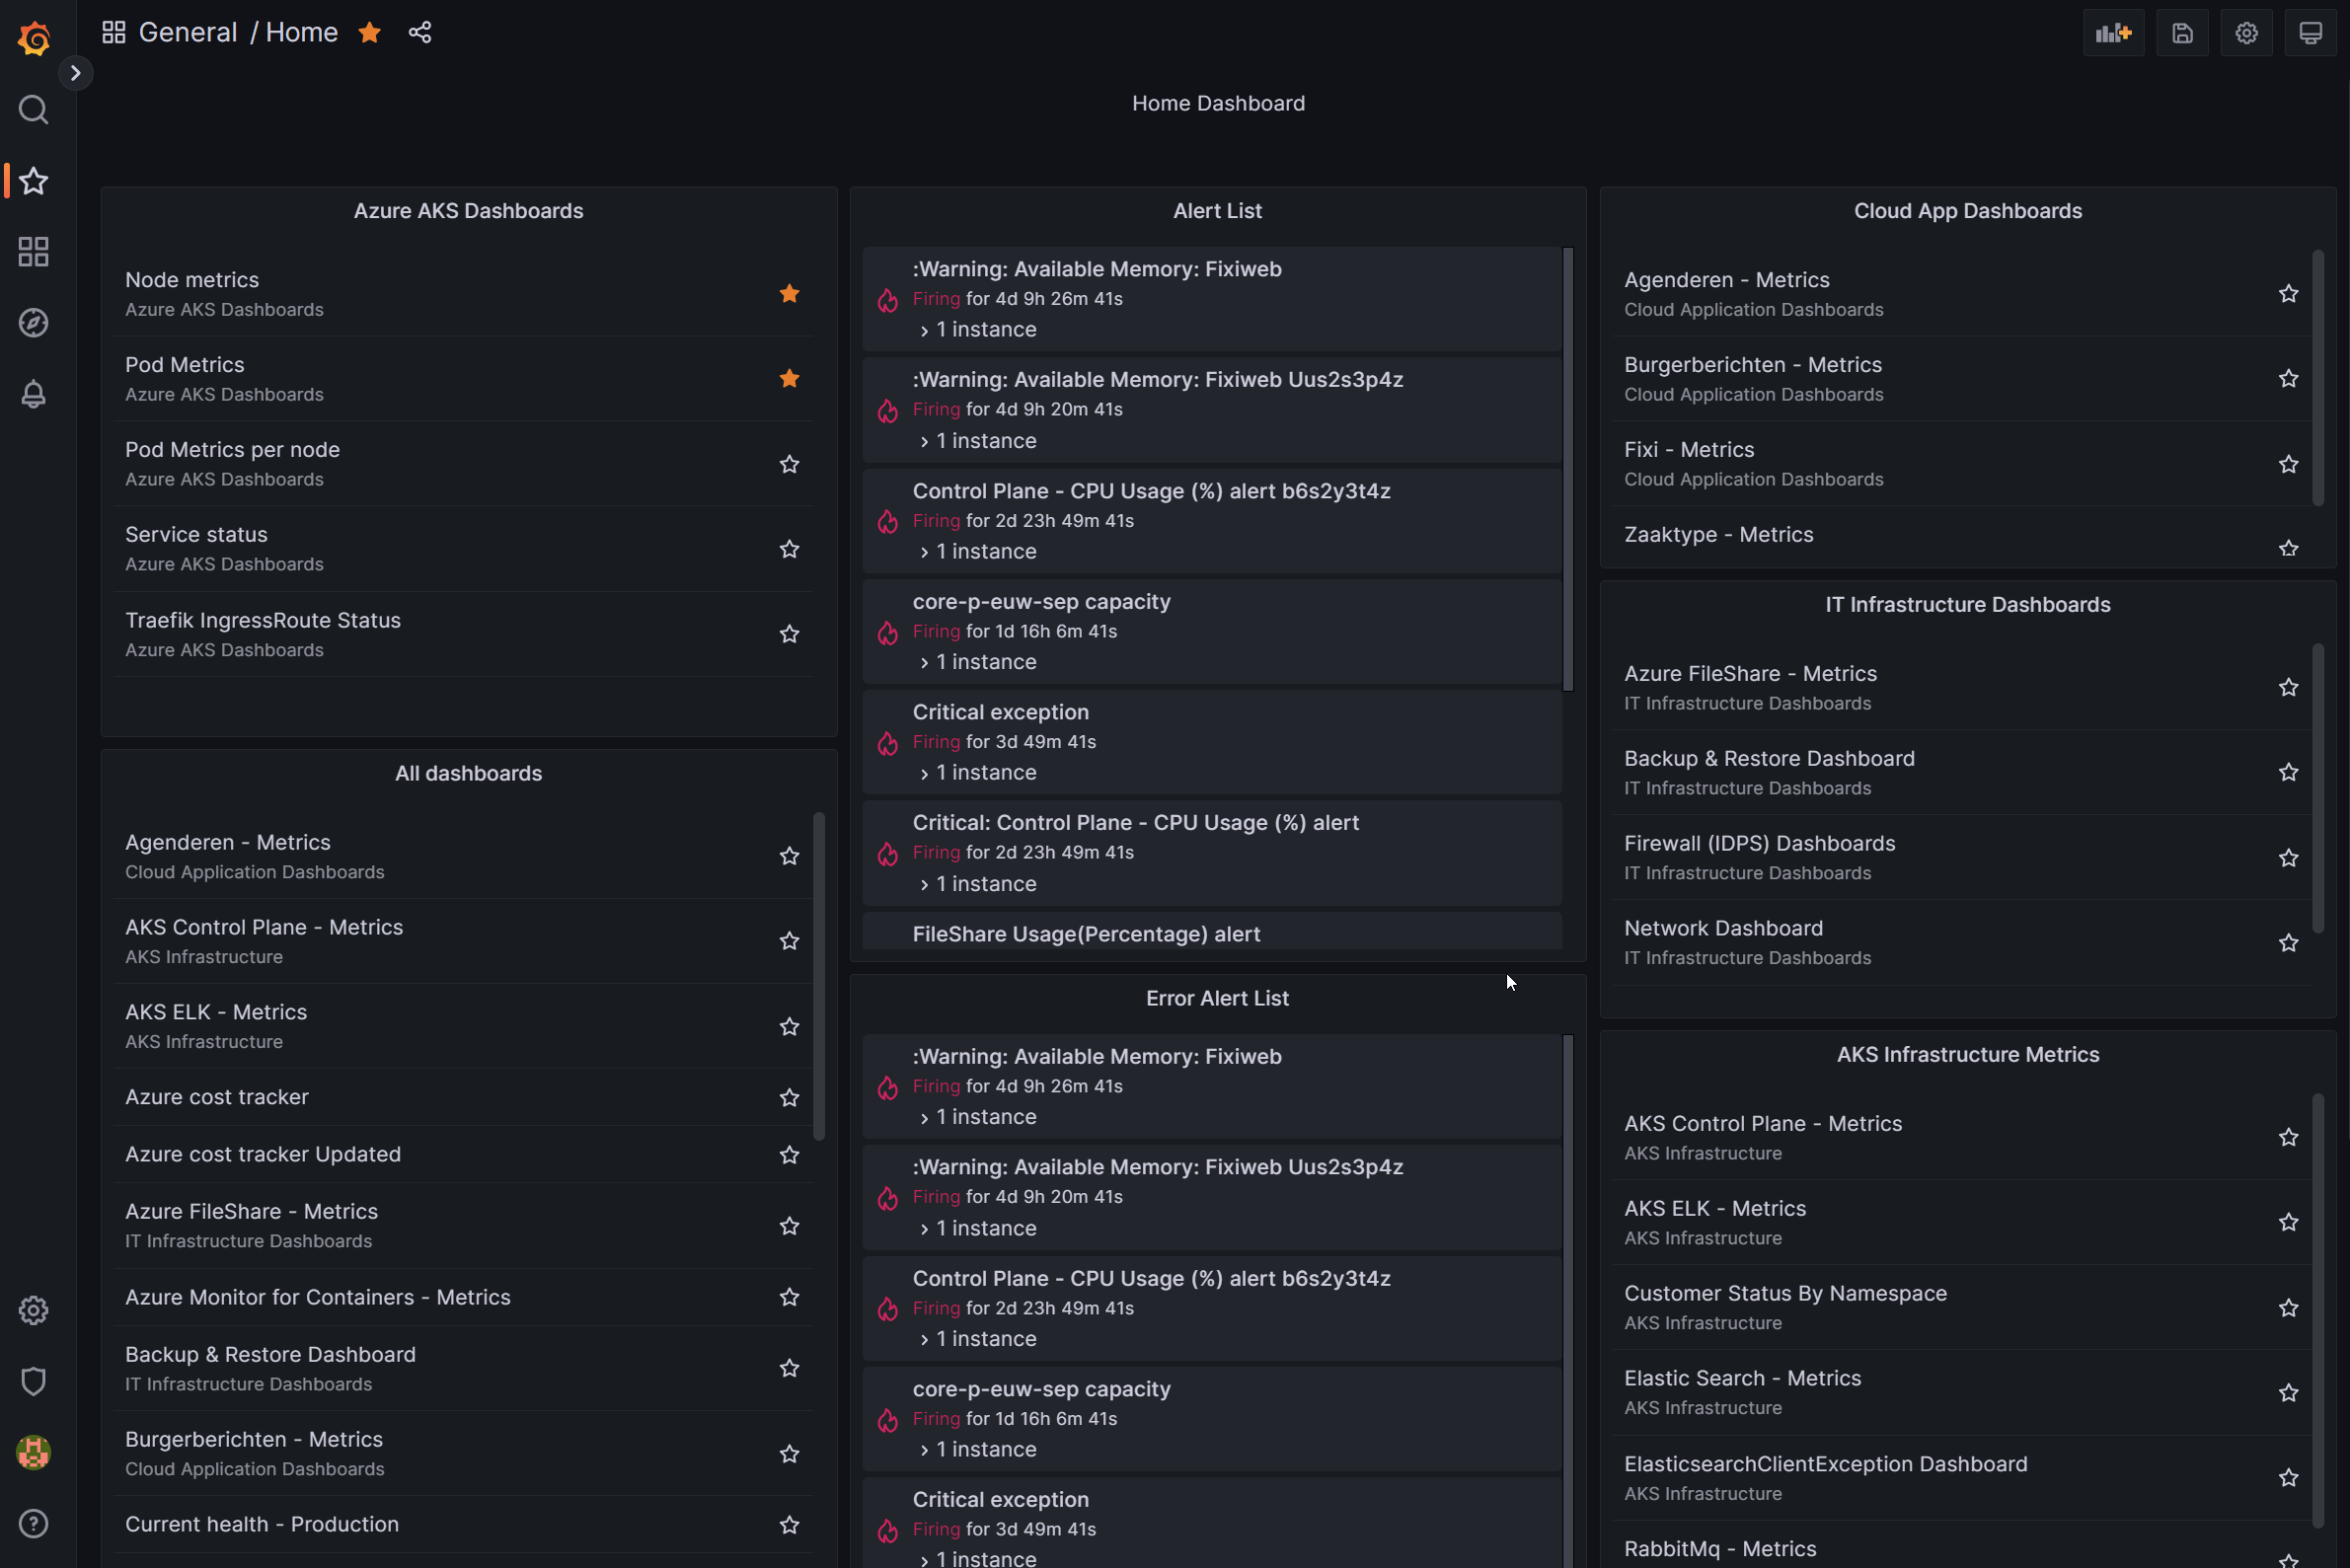
All virtual machines details
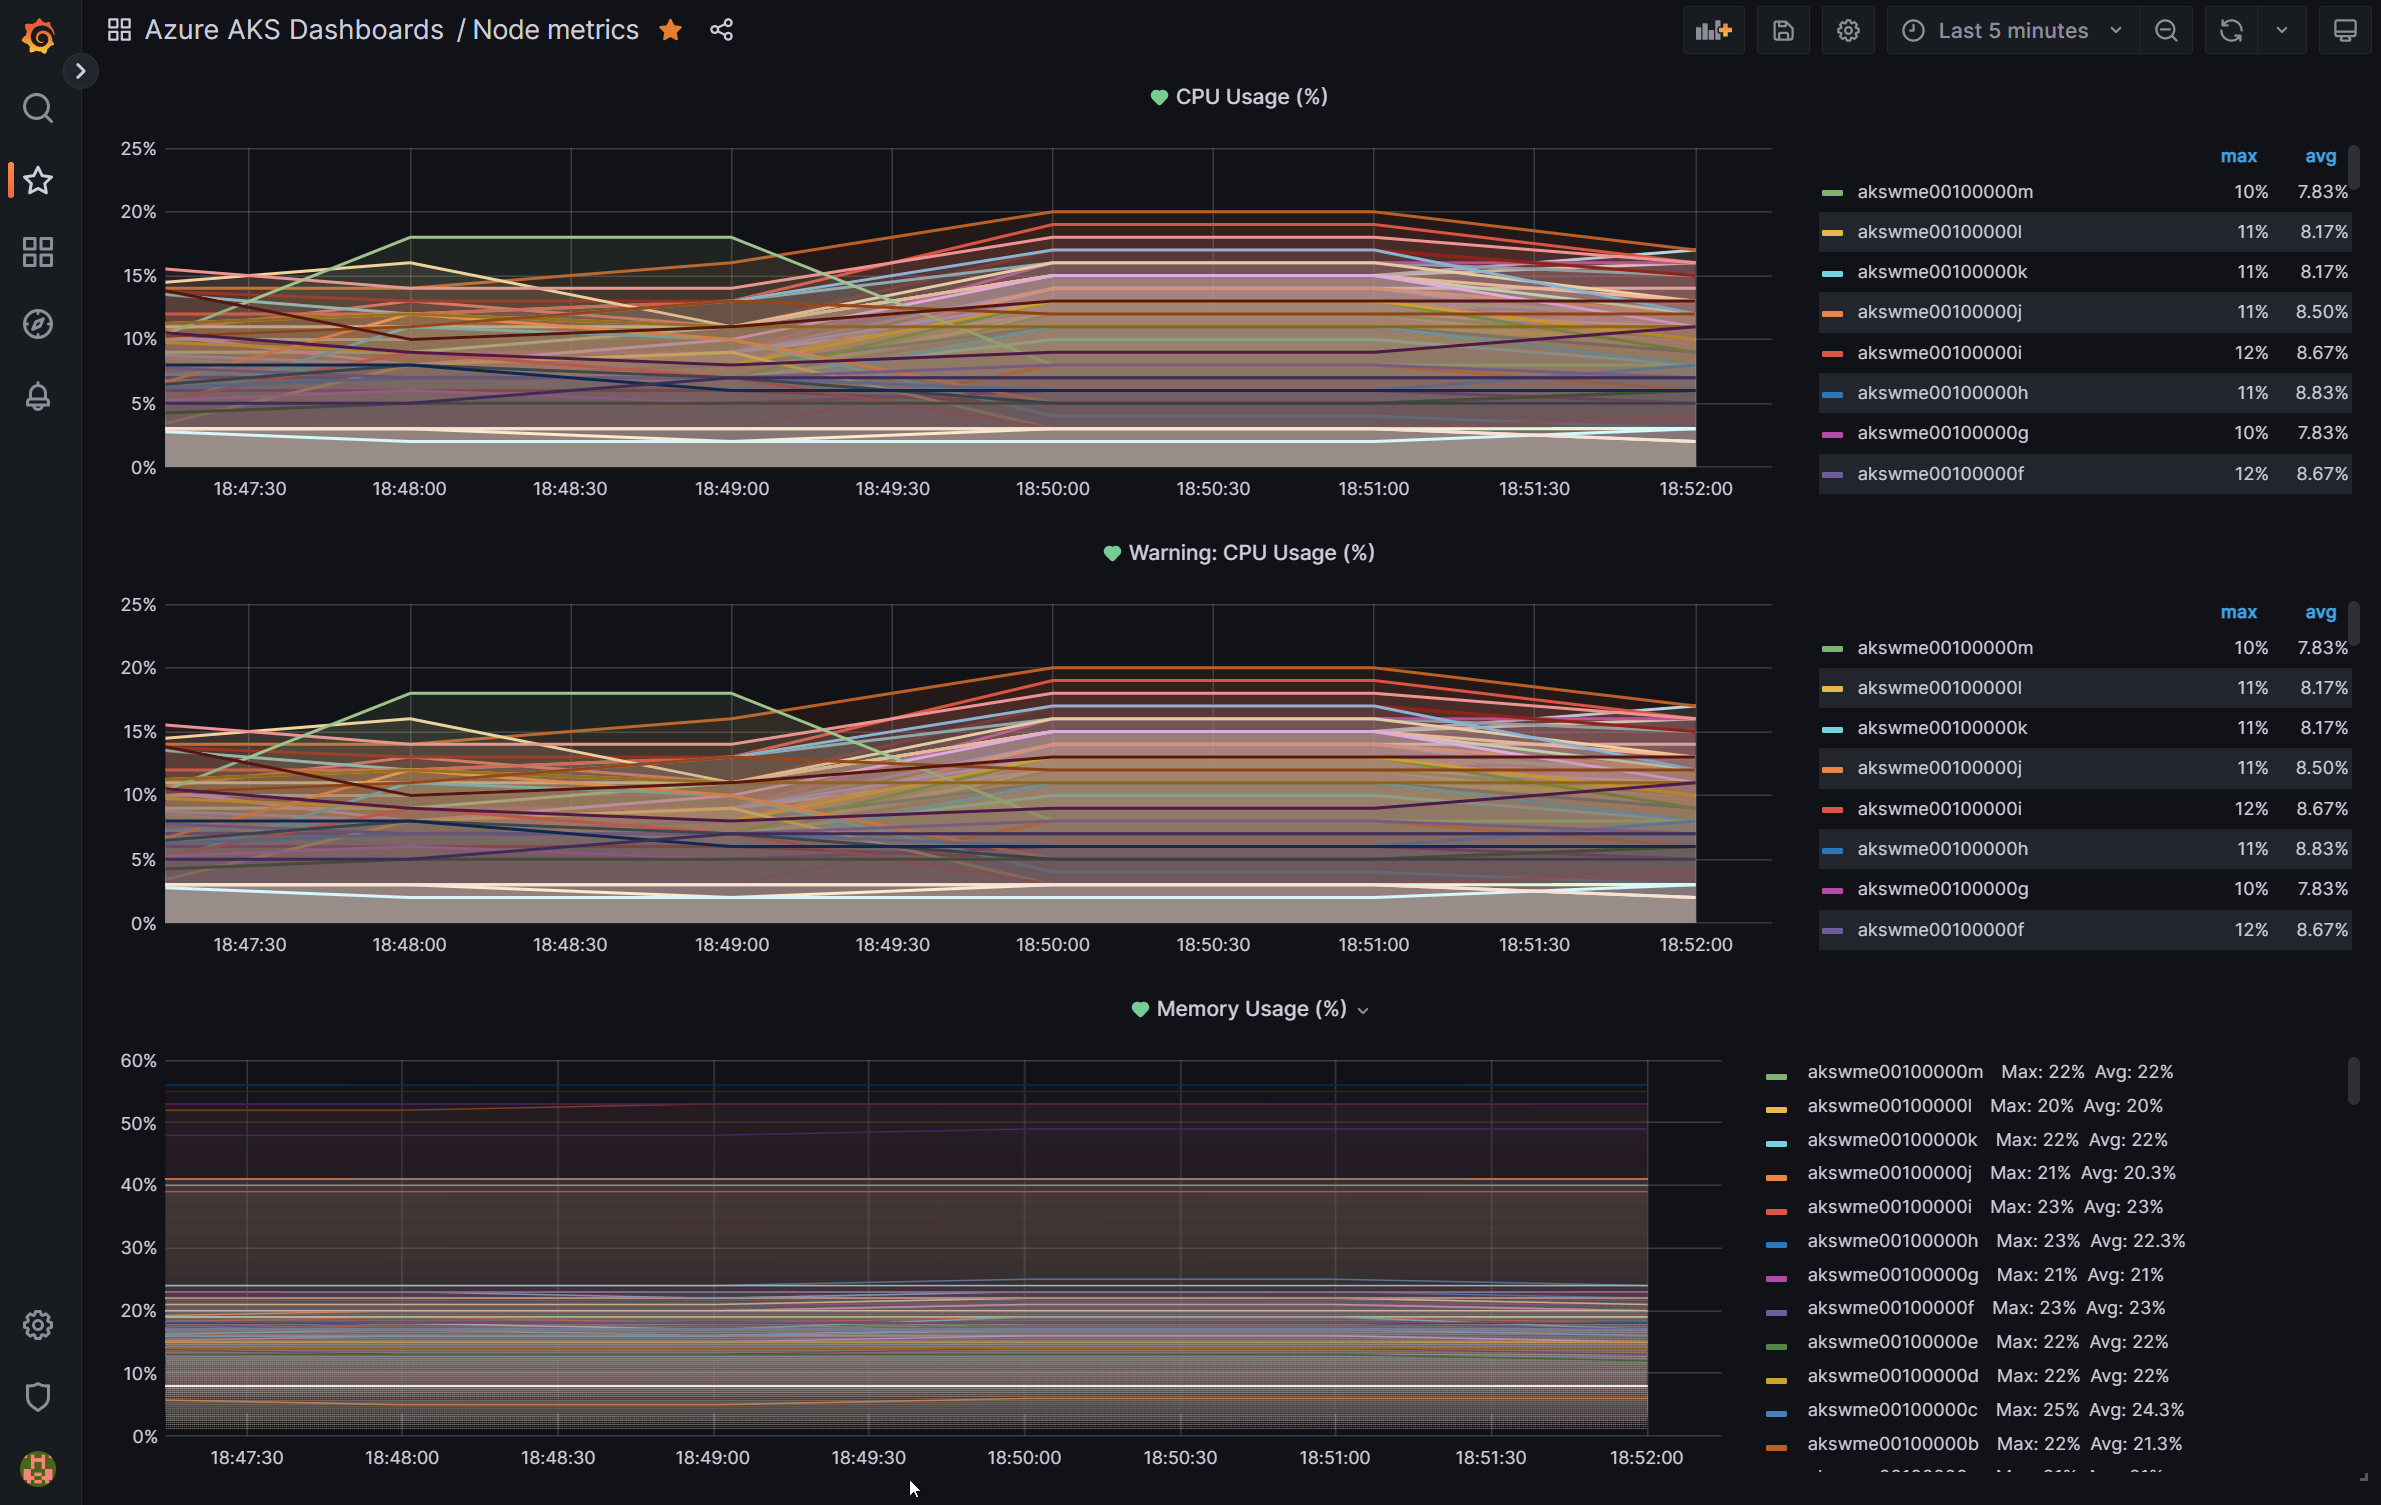
This allows us to check memory and cpu usage of all virtual machines
Details of single virtual machine with respect to workload on that instance
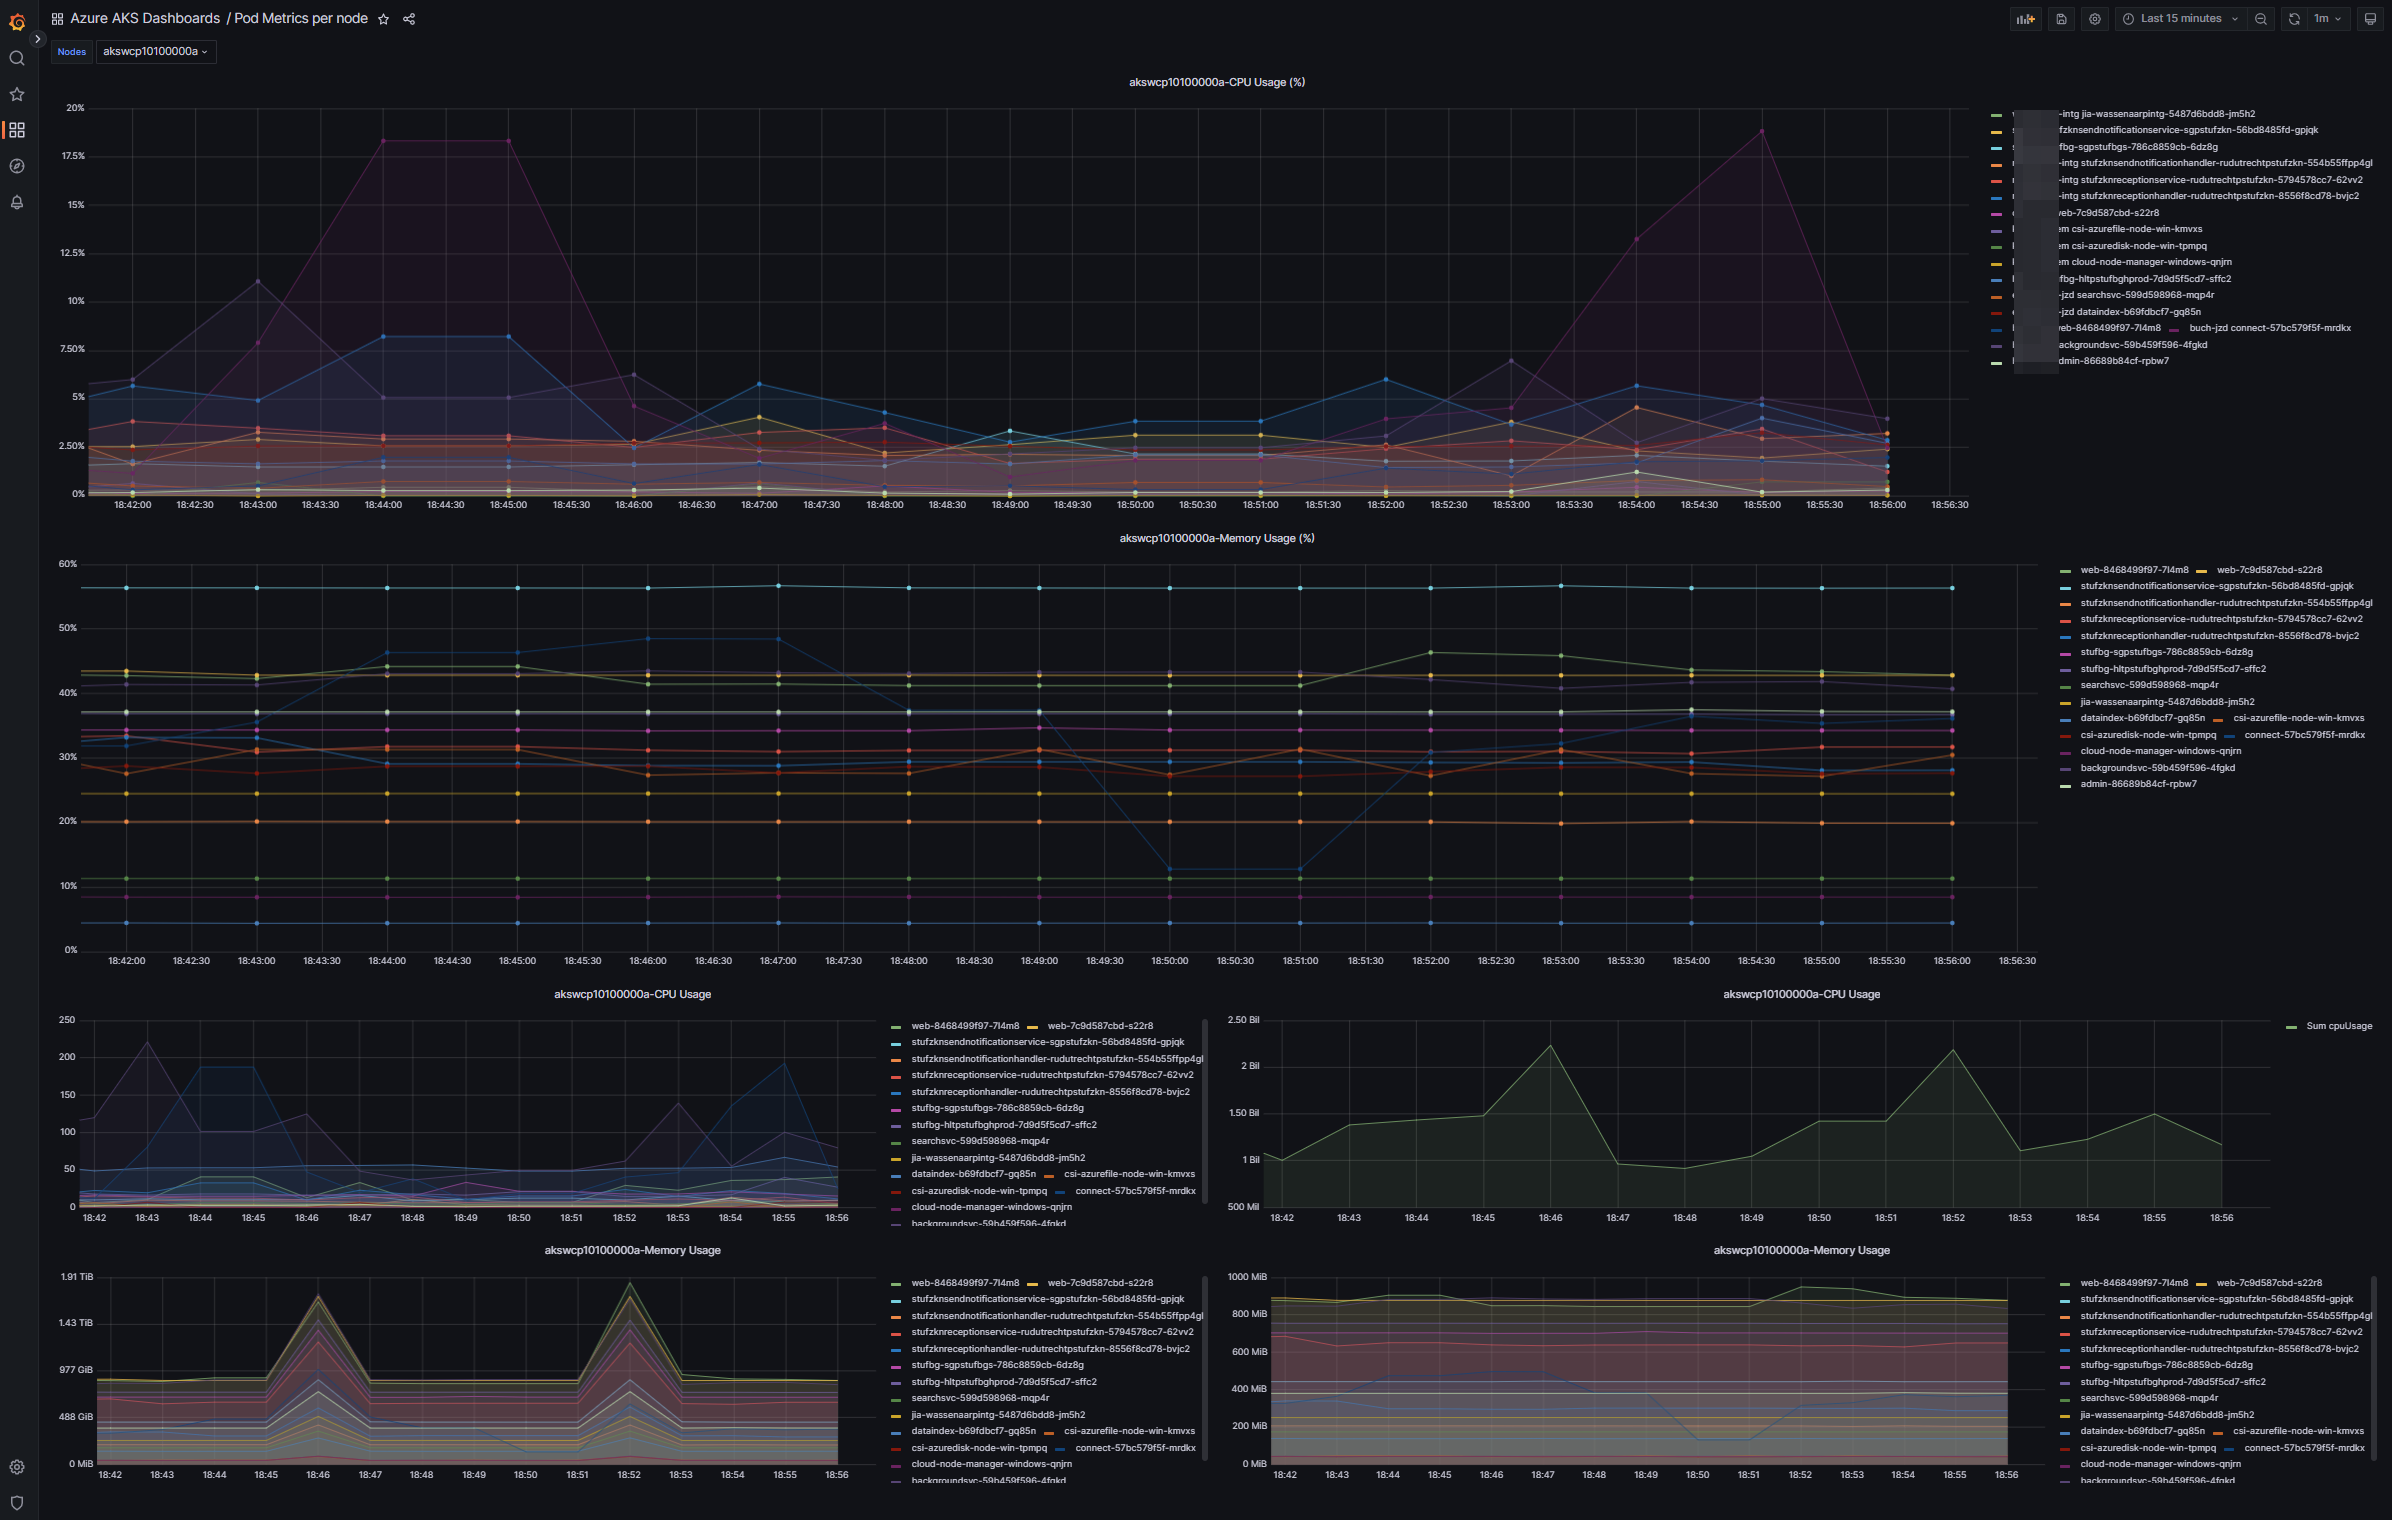
This helps to check metrics of workload running on virutual machine instance
Statistics for JZD product of a customer
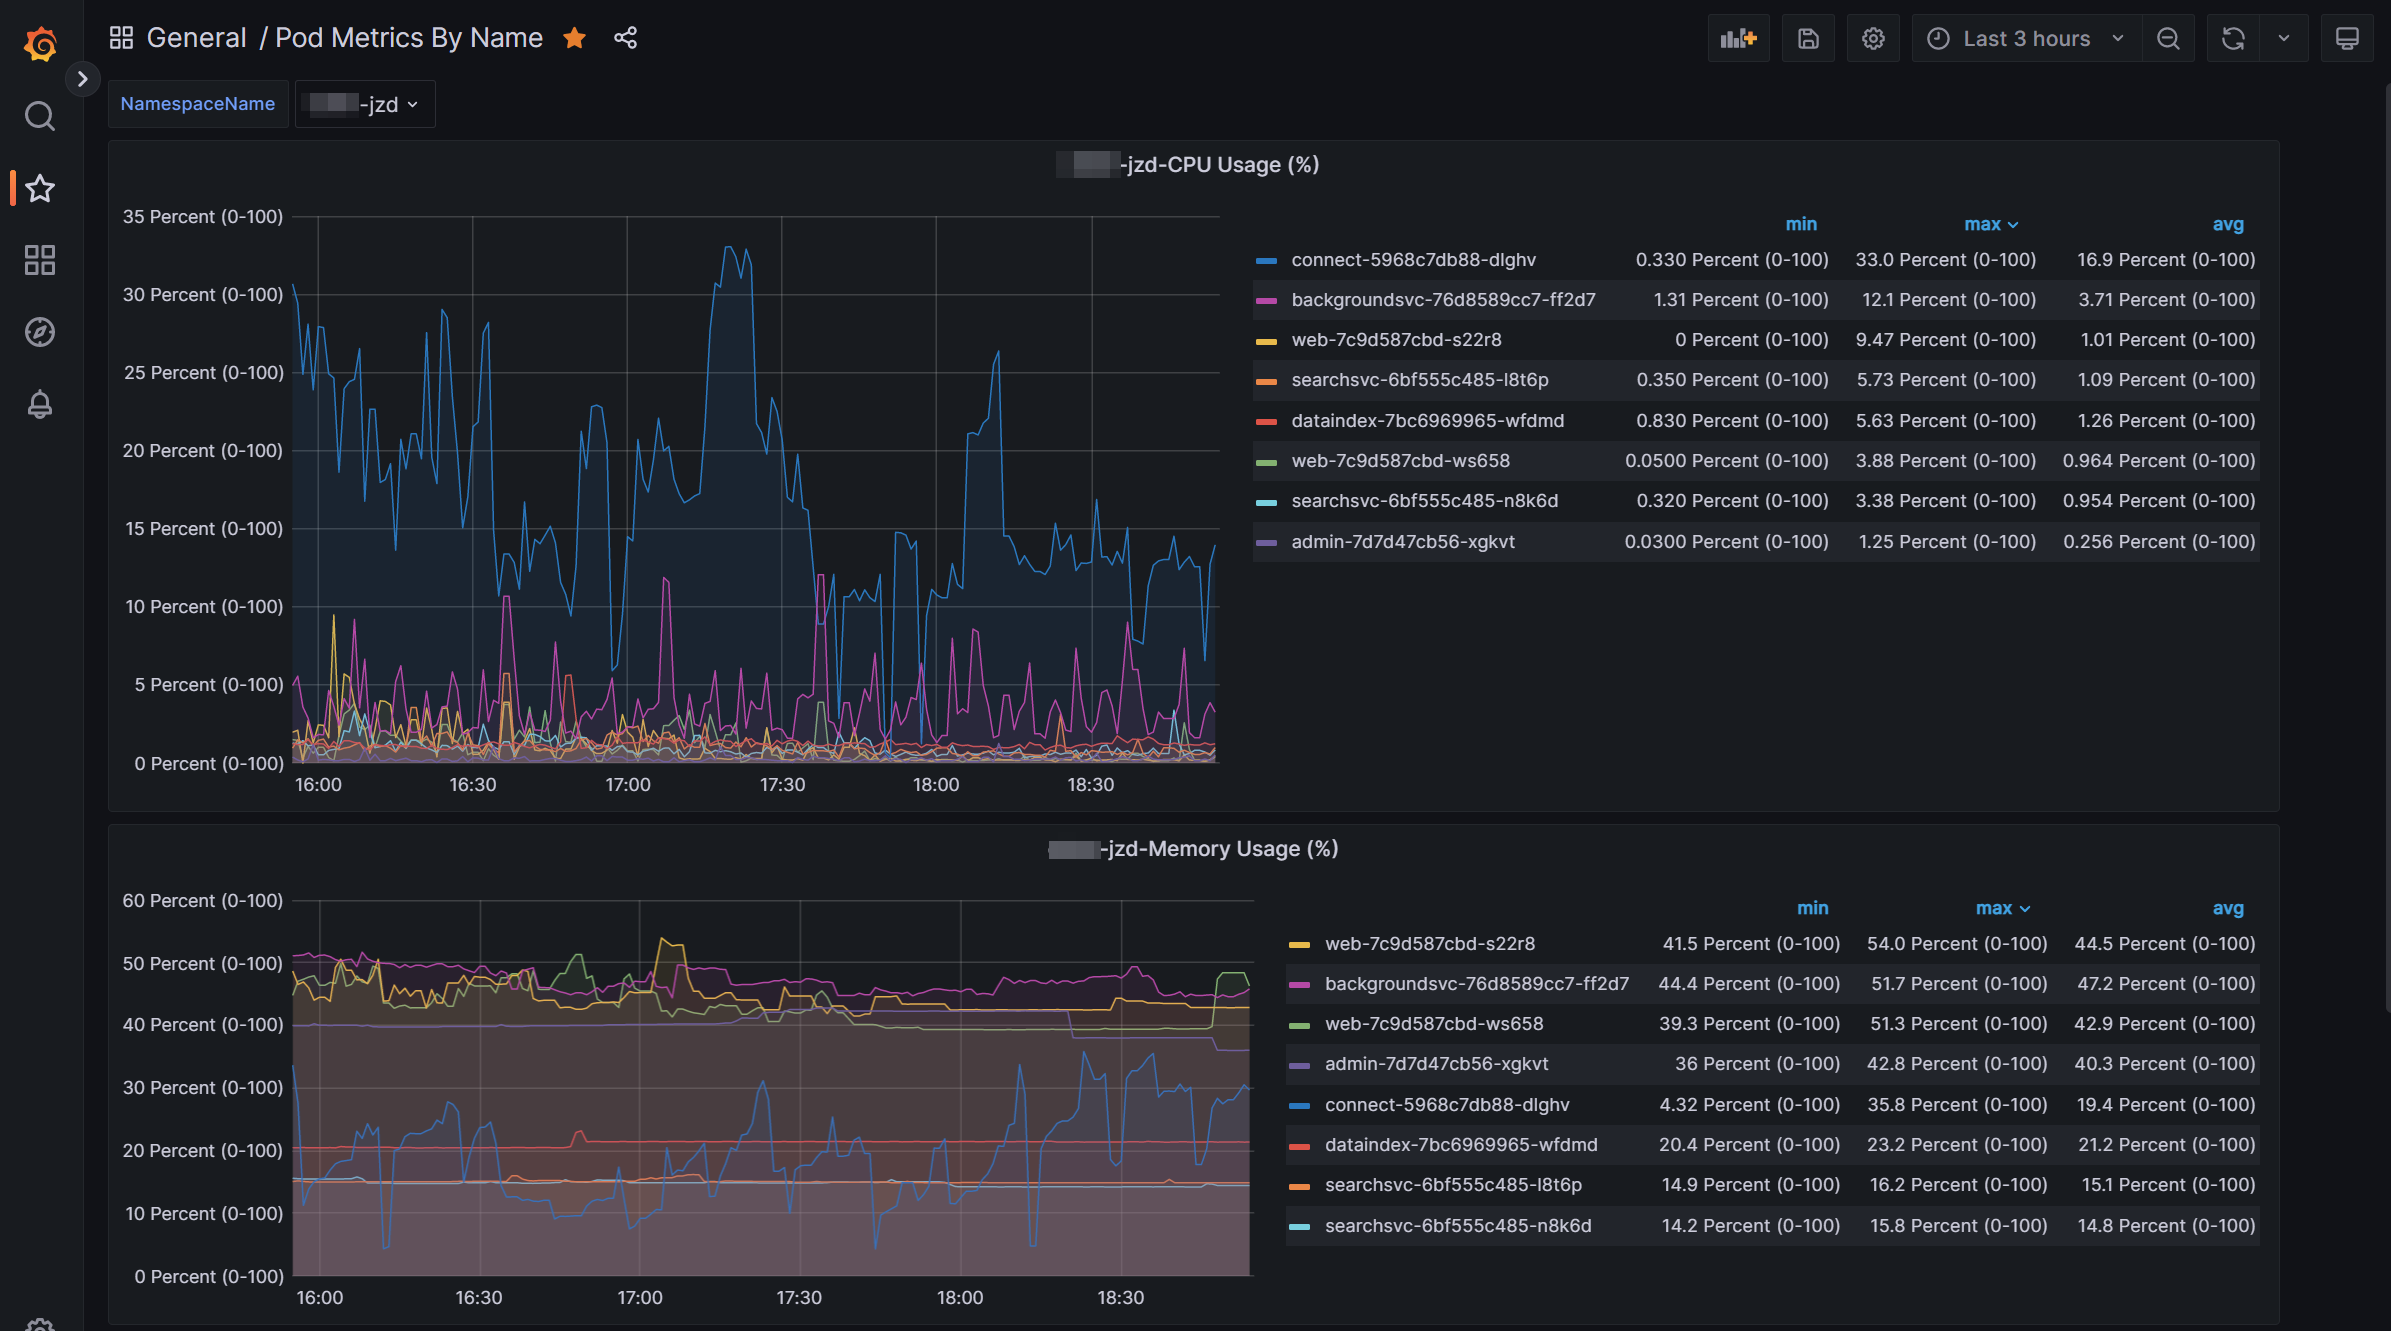
This helps us to monitor metrics of workload per product and customer. This helps us in indentifying any usage patterns/recurring issues with resources.
Service status
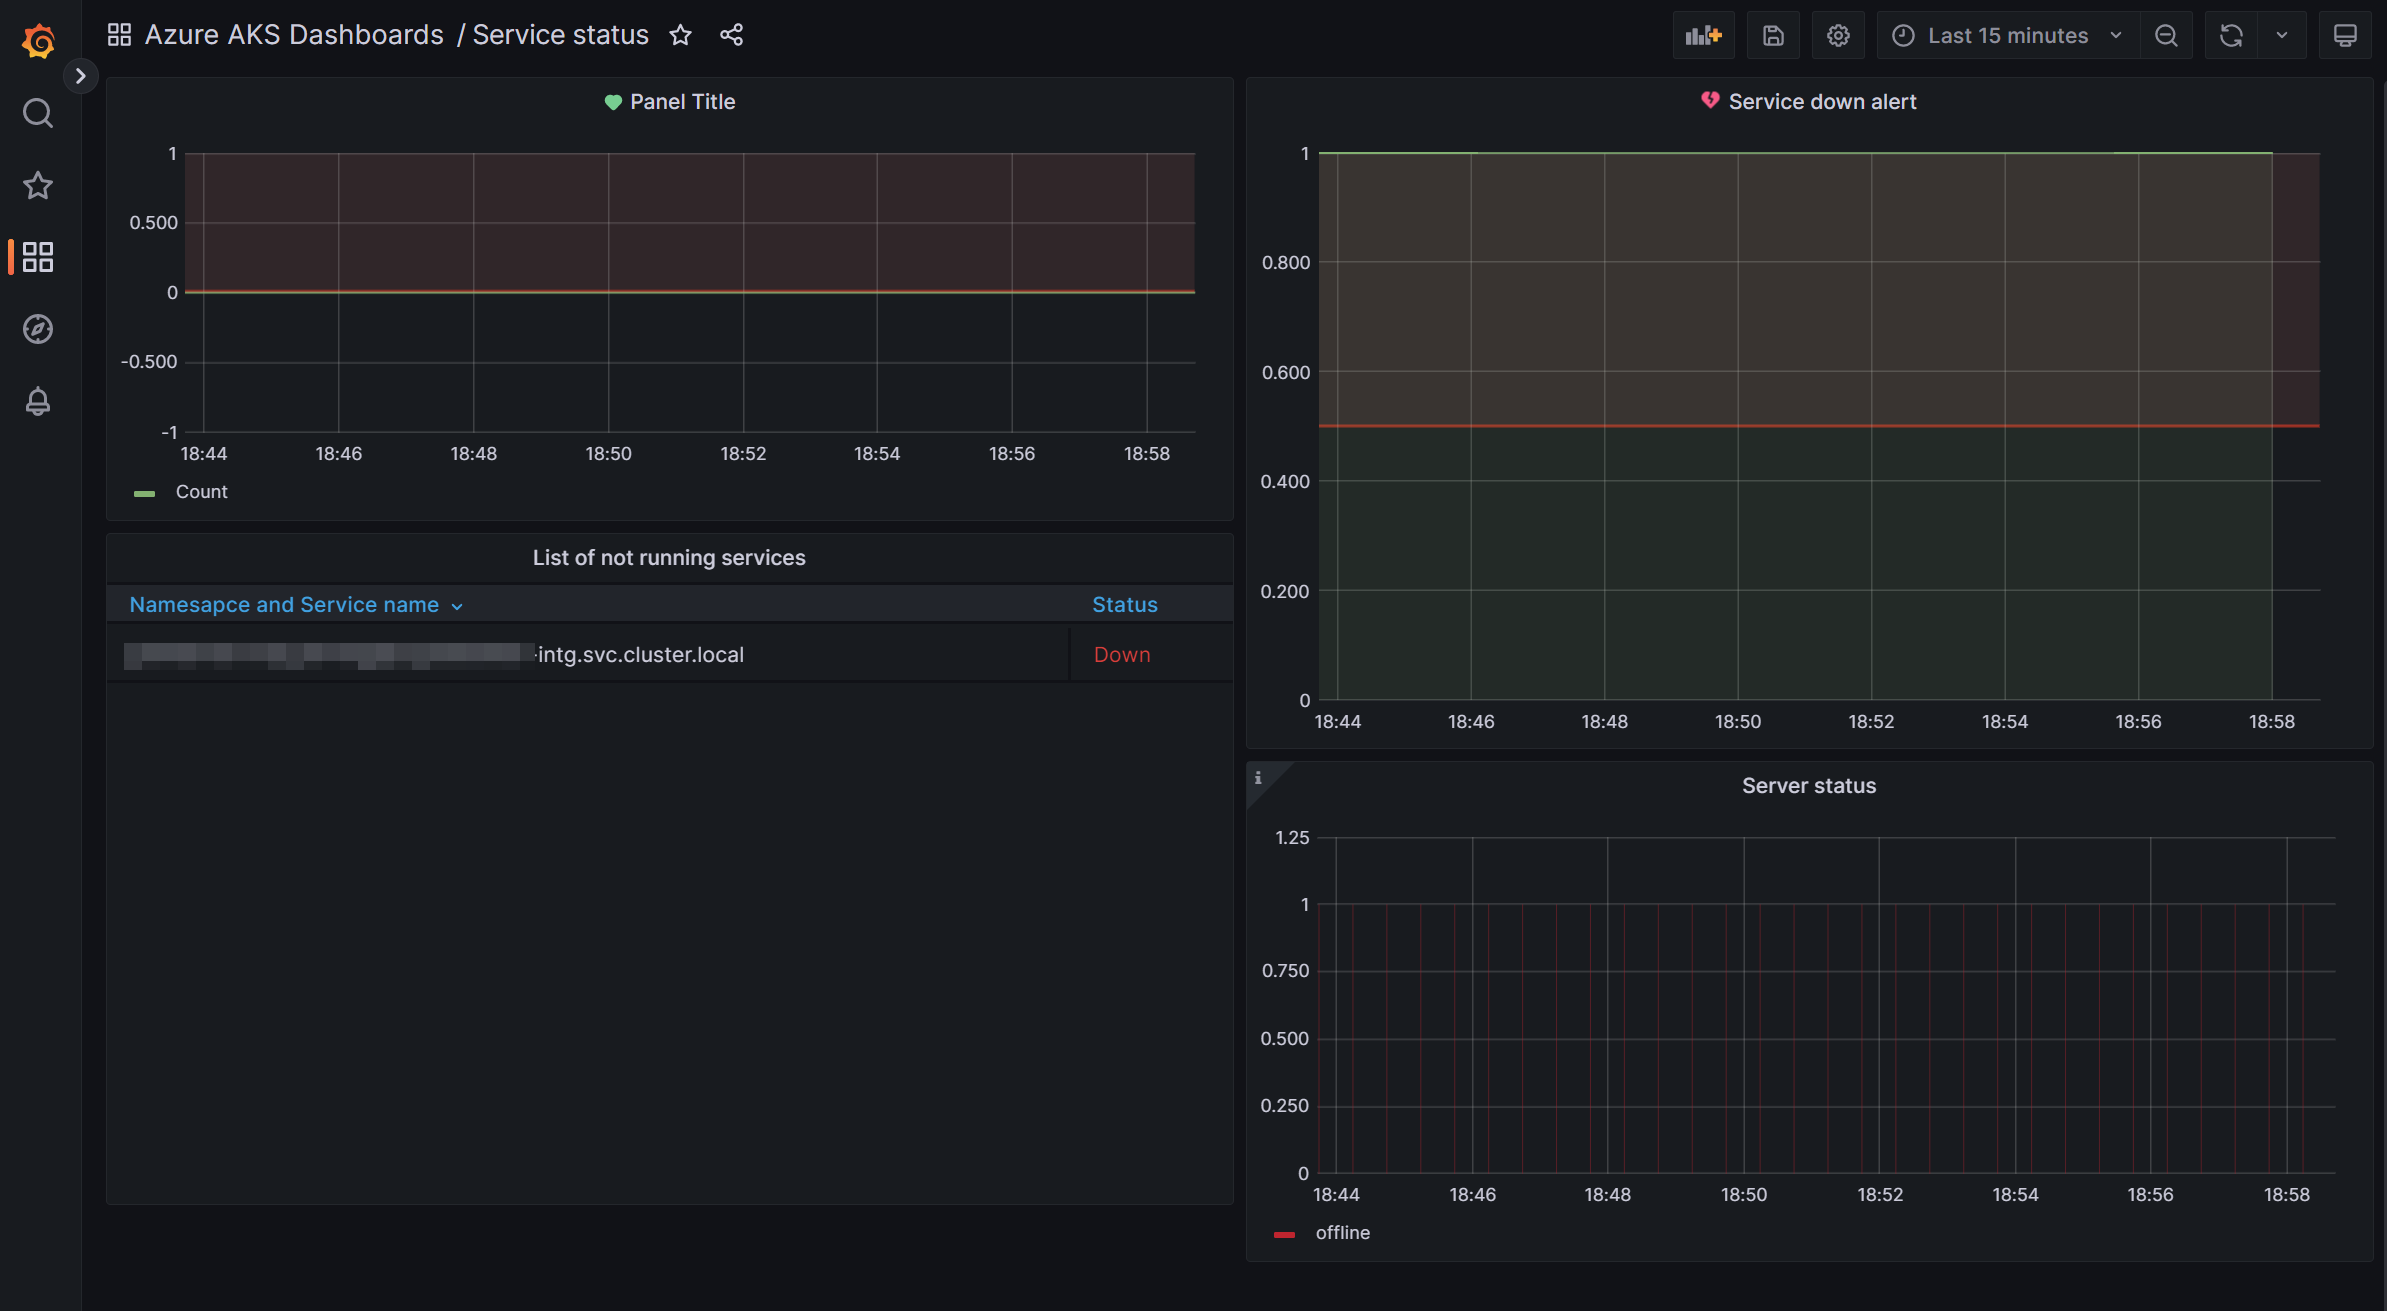
Here we monitor health of all our services running in AKS. We can see an sample of one of the imtgeration service is down.
Database
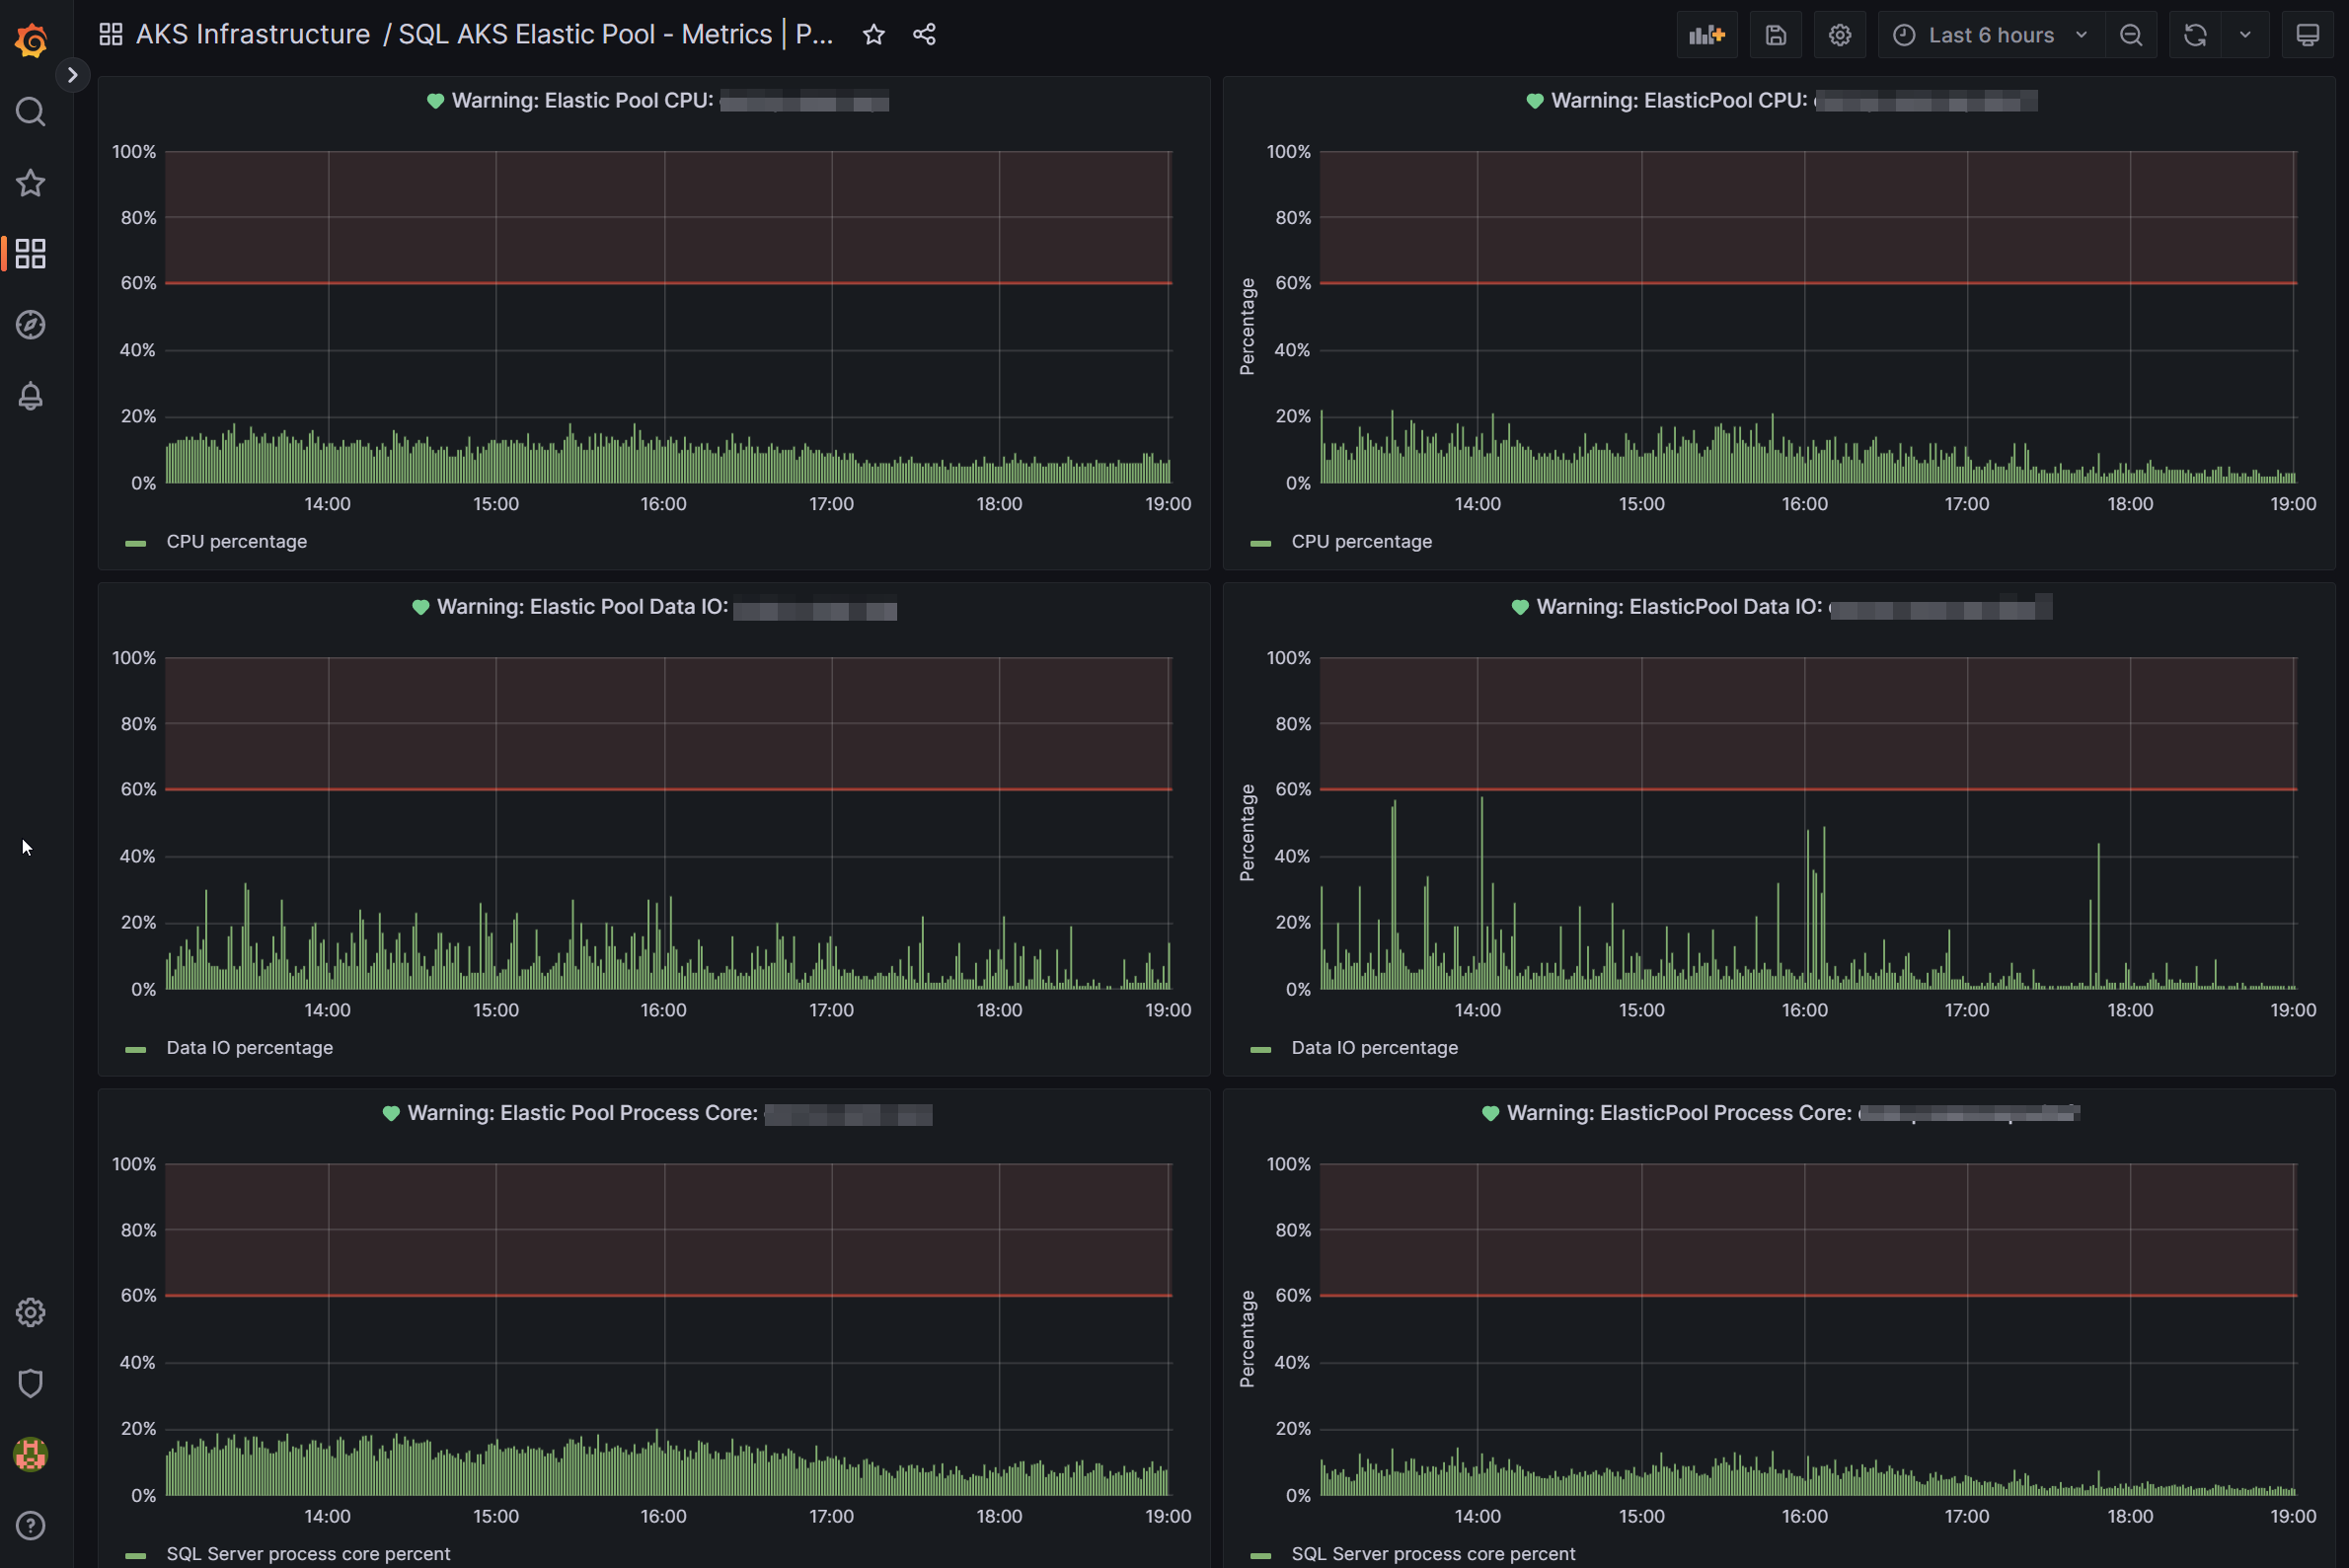
We monitor health of our database server. This helps us in highlighting resource corrections/upgrades.
¶ Alerting
We use teams for alerting all our AKS health successs, warnings and erros. We also use freshdesk ticketing system where automated tickets are created when we have alerts which needs investigation and changes in infrastructure or product.
Here are few samples from our team alerting:

When a product is migrated to different version.
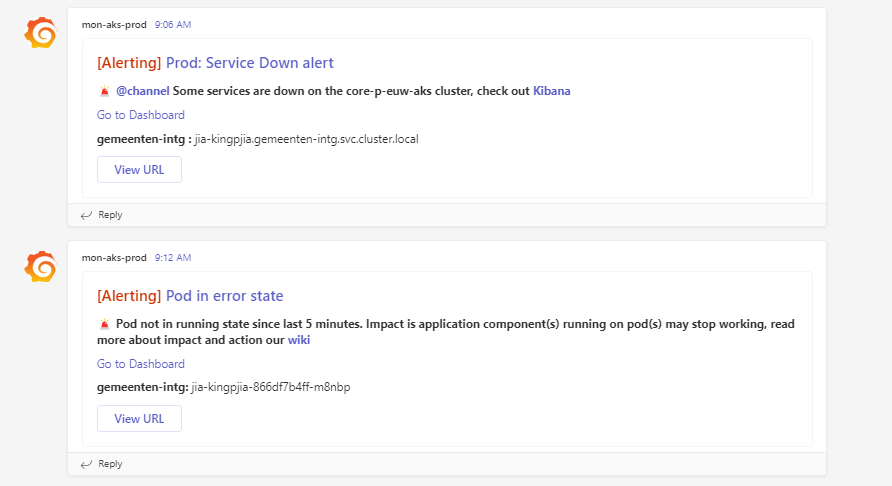
When a service is down/not working.

When a service is back in healthy state.

When there is a high cpu usage for any workload.

When high cpu usage is back to normal after any manual or automated actions.

Database resource usage goes above 60% which is imeediately alerted and dev team starts the further action.
¶ Conclusion
Gathering metrics, monitoring components, and configuring alerts is an essential part of setting up and managing production infrastructure. Being able to tell what is happening within our systems, what resources need attention, and what is causing a slowdown or outage is invaluable. Above details shared are smaller overview of few things from our monitoring infrastructure. This monitoring and alerting system goes under continous evaluation, upgradation and corrections at Decos.