¶ Overview management
General overviews and Excel overviews are reports that the administrator creates in JOIN Admin. The end users can consult these overviews in JOIN Case & Document. In JOIN Admin it is possible to predefine which data will be displayed and in which form it will be displayed on the end user’s screen.
¶ Toolbar at Overviews
The following buttons are available in the toolbar of the Views:
| Button | Explanation | Tests |
|---|---|---|
| Back to the list | Alt B. | |
| New overview | Alt N. | |
| Save | Alt S. | |
| Cancel | Alt C. | |
| Delete overview. This deletion is permanent and cannot be undone. | Alt R. | |
| To copy | Alt O | |
| Generate overview. Pressing this button will preview the selected overview. You then have the option to view the results of the overview at any time. | Alt G. |
¶ Create new overview
_ Click in the Navigation on Overview management -> Overviews. A list of available overviews appears in the Center.
File: Create New Outline.png
- Click the New button.
- In the screen that appears, enter the name of the new report.
File: New Screen.png
Select the way in which the overview should be displayed and printed from the drop-down list at Overview type. You can choose from:
| Option | Result |
|---|---|
| List | The report is printed as a list |
| Form | The overview is printed as a form, where all data is presented one below the other. |
| Merge file | The overview is combined with a Word template and can then be printed in Word. |
| Publication | The overview is published on an internet / intranet page. |
| XML export | The overview is copied in XML format to a specified directory. |
| Export selection | The overview is copied to another database. |
| Email summary | The overview is periodically sent by e-mail. |
| Management overview | The overview is shown in a graph view. |
The type of report you select determines the data that appears on the Layout details tab.
- If you have divided the overviews into groups, so that the whole remains clear, you can also indicate in which group this overview should be placed on the screen.
- Click on Save in the toolbar.
¶ Books tab
File: Tab Books2.png
-
On the Books tab you can tick one or more books for which you want to use the data. You can also tick subbooks.
-
If you select at least two books, you can check the option Group results by book.
File: Group Results.png -
As soon as you tick a book, the Query definition and Layout details tabs become active.
-
Tap on Save in the button bar.
¶ Query definition tab
File: Query.png tab
On the Query definition tab you indicate which data and which fields of the selected book should appear in the overview.
- In the left part of the Center, you will see the selected book type with the data associated with this book type.
- Check the book types that should be included in the overview. You will see that the overview of fields on the right adapts to the options you choose.
- Under Item profile, use the drop-down arrow to select the desired item profile. As a result, you will only see those fields that are actually used. If you choose the default item profile, you will see all fields again.
- You can then make settings for each field. The different options, shown in the column names, are:
| Column name | Result |
|---|---|
| Field | Description |
| Show | Checked fields are shown in the overview. |
| Width | Number of characters in the field |
| Sort | Sort order of the print report. By clicking in the sort column next to a field, a “1” appears in the field. If you click again, this “1” will disappear. A “1” indicates that this field should be sorted first. If you move to the next field and click again, a “2” will appear. This way you can apply the complete sorting |
| Descending | Checked fields are sorted in descending order. |
| Filter condition | Selection criteria for this field. By clicking on the button in the Filter condition field you will get a screen in which you can add a search condition or a macro that you want to use for this field. |
| Or | Further selection criteria for this field |
| Formatting | Determines the display of a field, for example the way in which an amount of money is displayed with decimal places. |
-
The fields are displayed in the order shown. If you want to change the order, select the field with the arrow to the left of the field description. By then clicking on the arrows on the right of your screen, you can move the fields to the desired position.
File: Icon Arrows.png -
Depending on the book type you have chosen, options will become visible under the field settings that affect the display. The following options are available:
File: Field Settings.png
- Indent from previous level: In the final view, using indentation, displays a structure similar to the tree structure in the Admin Tool.
- Header with column names: Displays the headers.
- Primary search condition: building the result is done first based on this filter condition, so that the result is built faster.
- Only show registrations that do not meet this condition: this is an “inverse” filter condition. With this function, for example, an overview can be made of letters to which no confirmation of receipt is linked. This option is only shown for certain subtypes, for example files.
- Show thumbnails: this option shows thumbnails of files in the overview.
- Extra registration data: this option is used to save extra registration data as XML in the MEMO field.
¶ Layout details tab
Define the layout of the overview on the Layout details tab. The settings you see here depend on the type of overview you have chosen on the first tab at Overview type.
Layout details for type overview List or form overview
If you have selected List or Form in the Type overview on the first tab, the Layout details tab will show the data for creating a list or form overview.
File: Tab Layout.png
- At Language, select in which language the field names and data should appear in the overview.
- At Registration separator, choose whether you want to separate the different registrations in the overview or not. You can choose between no separation, a line between each entry and each entry on a separate page.
- If you are creating an overview from different books, you can choose in the Group separator option whether you want to separate the different groups in the overview or not. You can choose between no separator, a line between each group and each group on a separate page.
- Under Lines per page, indicate how many lines per page you want to display.
- If you want to provide each page with a header and footer, enter this in the Header and Footer fields. Click the button (AA) behind the field to set the font and font size.
- Enter the title of the overview under Title. It is only shown on the first page. Click on the button behind the appropriate field (AA) to set the font and font size of the title.
- You can use macros when printing the header, footer and title. These are slightly different from those used with item profiles, namely:
| Print macro | Gives |
|---|---|
| % DATE% | Print date |
| % NAME% | Name of the overview |
| PAGE% | Page numbering |
- You can then select the font and size for the column names and the actual data. This is possible for both main and sub overviews. Click the button behind the relevant field (AA) to make a choice.
- Click on Save in the toolbar.
¶ Layout details for merge file type
If you have selected mail merge file in Overview type on the first tab, you can select a template with which the overview should be merged on the Layout details tab.
File: Merge File Layout.png
- Select the desired template using the drop-down arrow
- Click on Save in the toolbar
¶ Layout details for type of overview publication
If you have selected publication in the Type overview in the first tab, the Layout details tab will show the data for generating a publication.
File: Layout Overview.png
- Use the button behind the Source folder field to select the directory in which the templates for your publication can be found. In this case, the templates must be HTML templates.
- Use the button behind the Destination folder field to choose where the generated publication should be placed on your computer.
- At Language, select the language in which the field names and data should appear in the overview.
- Check Convert documents to PDF if you want to publish documents as a PDF file. You can also choose Generate secure PDF documents, to make sure that the PDF file never changes again.
- At Document field in the file name, choose a document field to use.
- Check Periodic export and specify a number of hours if the publication must be repeated periodically.
- Click on Save in the toolbar.
¶ Layout details for type overview XML export
If you have opted for XML export in the Overview type on the first tab, the Layout details tab will show the data for generating an overview in XML format.
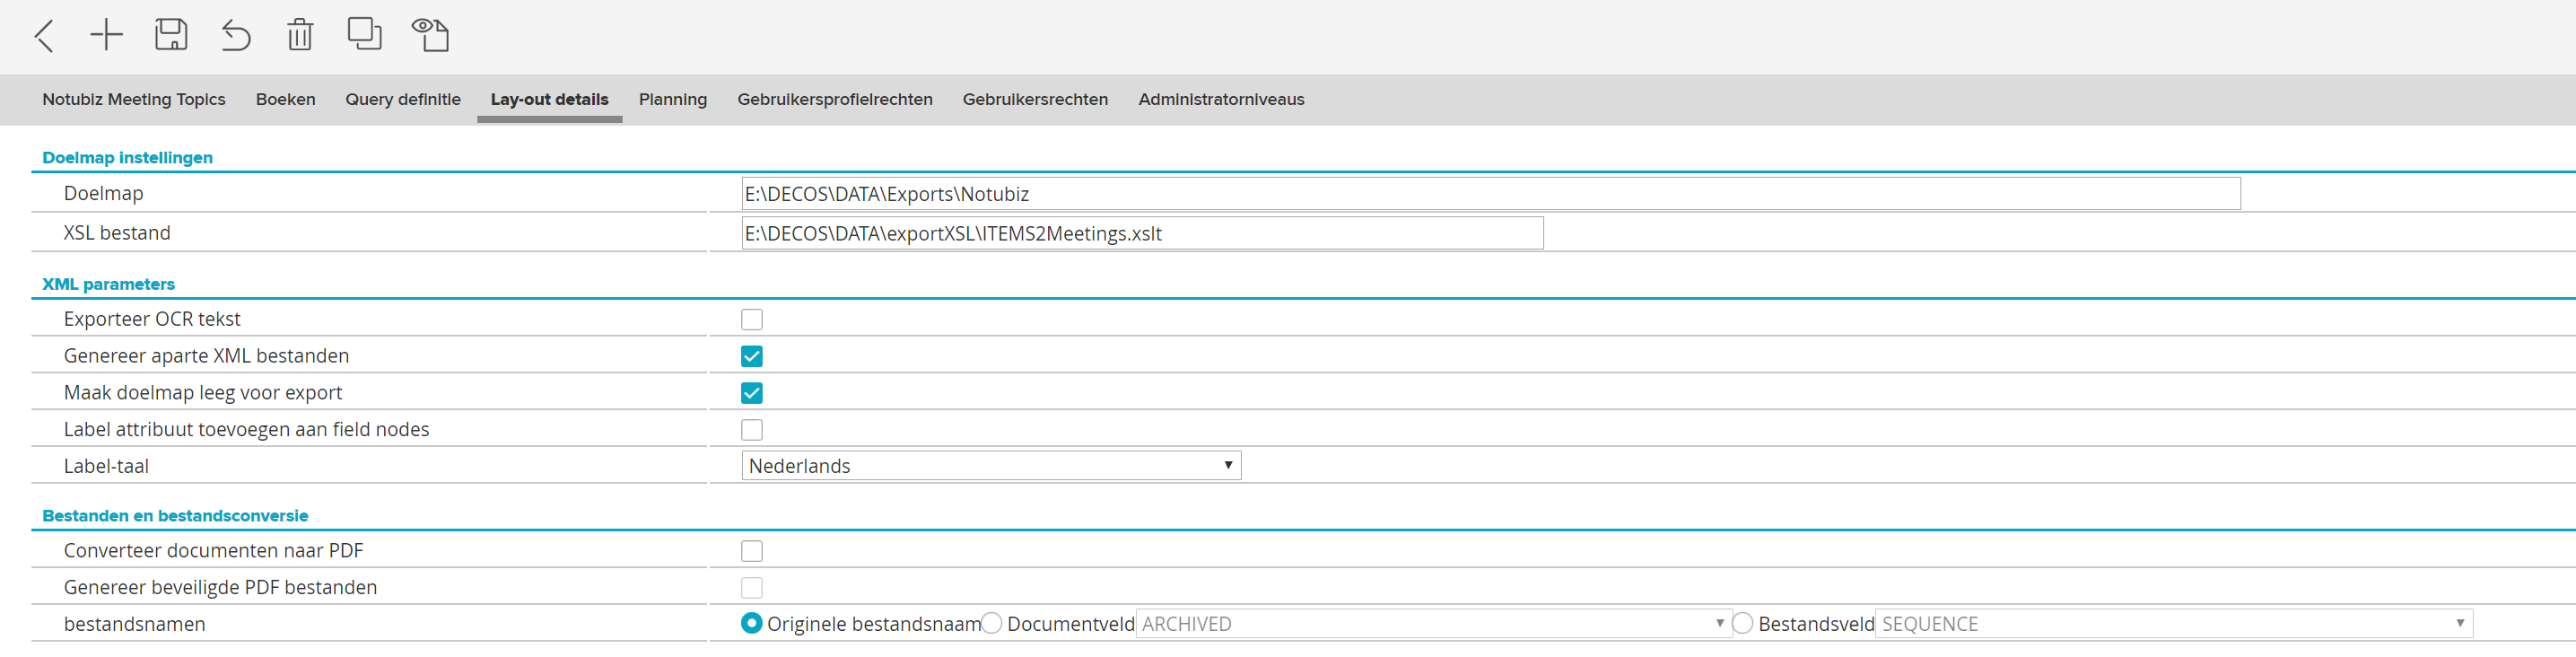
- With the button behind the Destination folder field you select the directory where the generated XML files should be placed on your computer.
- Next to XSL file, enter the name of the XLS file in the destination folder.
- Check Export OCR text to include the OCR text, which is stored with scan pages, in your overview in the XML files.
- Check Generate separate XML files if you want to generate XML files separately.
- The Clear destination folder for export option clears the folder where you want to save the file before exporting. This gives you more space in this folder.
- Check Add label attribute to field nodes if you also want to include field descriptions from the item profile in the XML file
- Set at label language which language should be used (with item profile)
- Check Convert documents to PDF if you want to publish documents as a PDF file.
- Optionally, also select Generate secure PDF documents if you want to protect the documents with a password.
- Check Document field in file name and choose a document field to use.
- Check Periodic export and enter a number of hours if the export must be repeated periodically.
- Click on Save in the toolbar.
¶ Layout details for type overview Export selection
If you have chosen Export selection in the Type overview in the first tab, the Layout details tab will show the data for generating an export selection.
File: Layout Export.png
- Click the button behind the Target database field to create the database connection for the external database.
- Check Export files to database to include the files in a table named DECOSBLOB in the external database.
- In Files of destination folder, select the destination folder for saving exported files. This folder must also be available if the files are included in the external database.
- Choose the document field you want to use in the file name using the drop-down arrow.
- Check Convert documents to PDF if you want to publish documents as a PDF file.
- Optionally, also select Generate secure PDF documents if you want to protect the documents with a password.
- Check Periodic export and enter a number of hours if the export must be repeated periodically.
- Click on Save in the toolbar.
¶ Layout details for overview type E-mail overview
If you have selected e-mail overview in the Overview type on the first tab, the Layout details tab will show the data for generating an e-mail overview.
File: Layout E-mail.png
- In the Template name field, you can select the template you want to link to this overview using the drop-down arrow.
- Under Recipients you will see a list of recipients. Double-click on the email addresses of the person who should receive the email summary. You will see these appear in the To field.
- Under Standard text enter the accompanying text of the e-mail that will be sent.
- Choose Show shortcuts in the overview if you want to include a link in the e-mail.
- Check Schedule this overview to send the overview periodically. At Frequency you indicate how often the overview will be sent (maximum once per day), how often it will be repeated, on which day the overview should be sent and at what time.
File: Layout E-mail In Actie.png
- Finally, you can tick two more options: Send delayed reports and Do not send empty reports.
- Click on Save in the toolbar.
¶ Layout details for type of overview Management overviews
If you have chosen Management overview on the first tab for Overview type, the Layout details tab will show the data for generating a management overview.
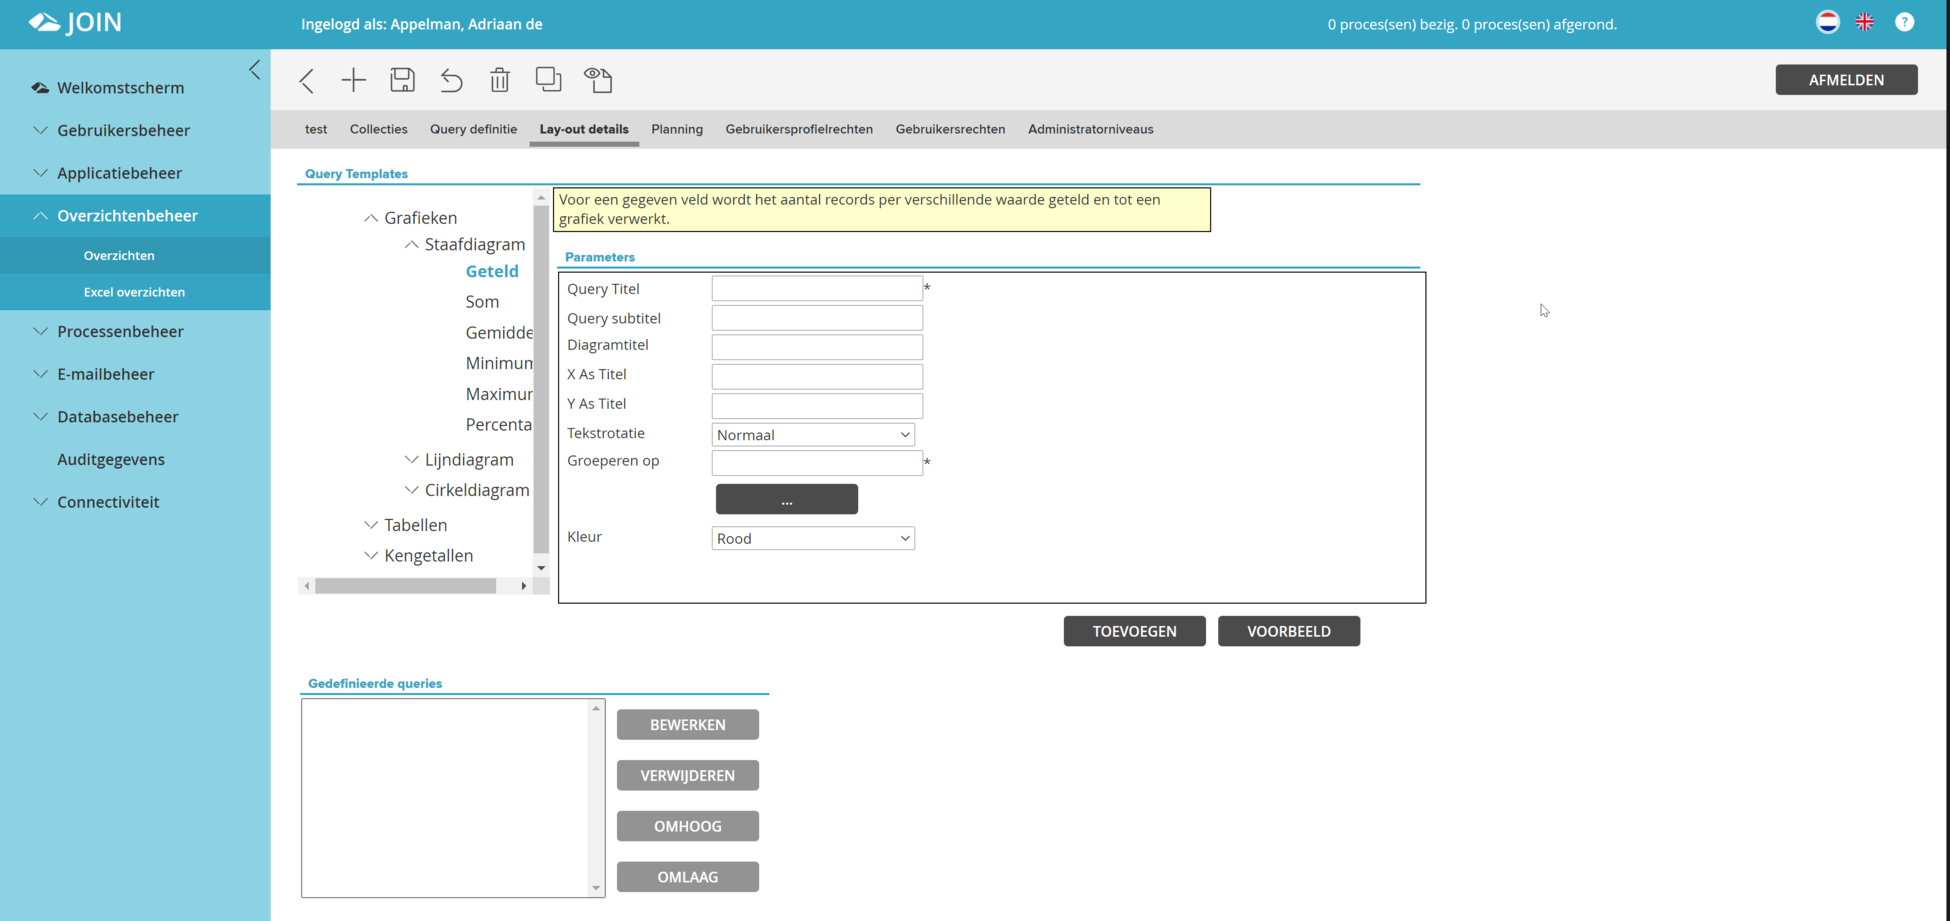
- In Query templates, click on the plus sign in front of Charts, Tables or Key numbers to determine the desired display. At Charts you can then choose between the display as a bar, line or pie chart.
- You choose the way in which the values should be processed in the overview for the different chart types. You have a number of choices:
- Counted chart
The various values are counted and processed into a graph. For example:
| Row number | Value |
|---|---|
| 1 | Executive Committee |
| 2 | Local council |
| 3 | Local council |
| 4 | Municipal Executive |
| 5 | Executive Committee |
| 6 | Local council |
A counted graph over the Value field then looks like this:
File: Counted Graph.png
- Sum graph:
In a sum graph, two fields are chosen: a counted field and a value field. The values of the different labels are added together and processed into a graph.
| Row number | Label | Value |
|---|---|---|
| 1 | Executive Committee | 6 |
| 2 | Local council | 5 |
| 3 | Local council | 18 |
| 4 | Municipal Executive | 3 |
| 5 | Executive Committee | 5 |
| 6 | Local council | 4 |
A sum graph over the Label and Value fields then looks like this:
File: sumgrafiek.png
_ Average, Maximum, Minimum
The average, maximum and minimum graphs work the same as the sum graph, except that instead of adding the average, the maximum or minimum values are determined and shown in the graph. These values cannot be processed into a pie chart.
Tables work the same as charts. Only the result is displayed in text. With Key Figures you can choose from the same numbers as with the Tables. Key figures can be used to display a single number, for example for the average of a field over all registrations in an overview.
In management overviews, you define the following parameters:
| Parameter | Description |
|---|---|
| Title overview | This title is shown above the graph or table at the output and is shown in the selection list of JOIN Case & Document. |
| Subtitle overview | The subtitle is shown above the graph or table on output. |
| Chart title | The chart title is above the chart in the graphical canvas. |
| Title X axis | This will be placed on the X axis. |
| Title Y axis | This will be on the Y axis. |
| Text rotation | Specifies how the text is displayed on the X and Y axis. |
| Counted field | This is the counted field as described for sum, average, and minimum / maximum graphs. You can select various items using the button behind the field. |
| Value field | This is the field that will be added to sum, average and minimum / maximum graphs, average, etc. Using the button behind the field you can select different values. |
| Maximum records | This indicates how many rows or groups are allowed. In a table, for example, a section ‘other’ will be added to a maximum of four records. The table will then always consist of four rows. |
| Color | Indicates which color is used in the final rendering. |
On the tab you will see a number of buttons:
- Add: This option adds the view to the list of defined views. The user can select his management questions in the web interface from this list under Defined views.
- Preview: gives you a preview of the defined management question on your screen. This way you can see various options before you capture the final overview.
- After you have compiled a management overview, you can later use the Edit or Delete button to delete or edit existing views.
Save the overview by pressing Save in the toolbar.
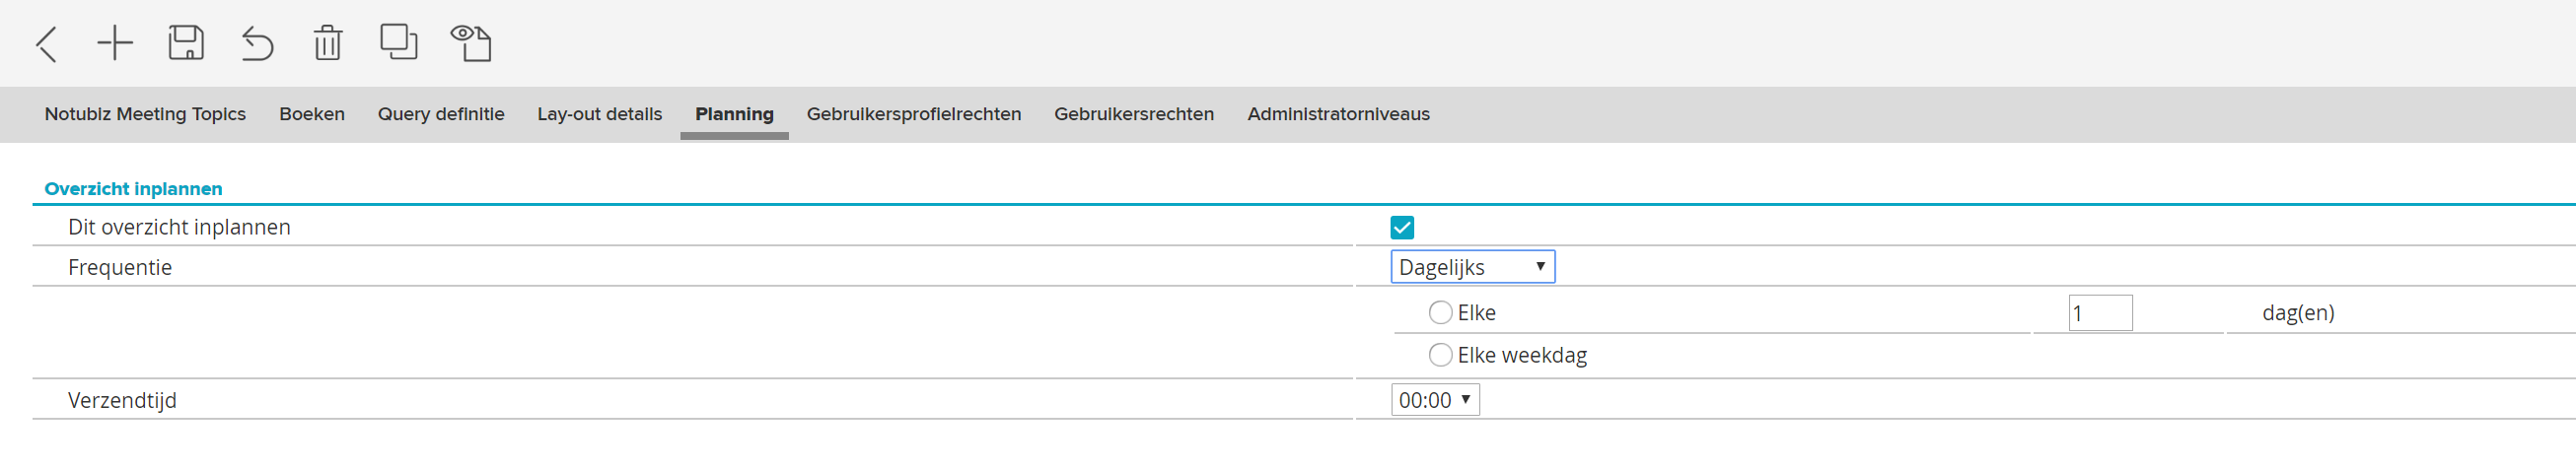
¶ Schedule tab
This tab is only available if you are creating a management overview. On the Schedule tab you can indicate at what times the overviews should be sent by e-mail.
File: Tab PLanning2.png
Check Schedule this overview to send the overview periodically. At Frequency you indicate how often the overview will be sent (maximum once per day), how often it will be repeated, on which day the overview should be sent and at what time.
- You can check two options: Send delayed reports and Do not send empty reports.
File: Tab Planning.png
Under Recipients you will see a list of recipients. Double-click on the email addresses of the person who should receive the email summary. You will see these appear in the To field.
- Under Standard text enter the accompanying text of the e-mail that will be sent.
- Click on Save in the toolbar.
¶ Schedule tab for XML Export
With the XML Export you will find the following settings:
The time you set for sending time is the fixed time at which the statement is sent.
¶ User Profile Rights tab
File: User Profile Rights Tab3.png
On the User profile rights tab you set the rights for each user profile. Determines what rights a user group has when using the selected overview.
The User Profile Rights tab displays the names of all available user profiles. If you have created a new Overview, each user profile has a check mark in the Default column. That means there are no rights. To set permissions:
- Click on the name of the user profile to which you want to assign rights. An arrow appears in front of the name.
- Place a check mark in the column with the rights you want to assign to this user profile. The following rights are possible:
- Standard
- No access
- Consult
- edit
_ Click the Save button to save the rights.
User Rights tab
File: User Rights Tab3.png
On the User rights tab you can set the rights for the selected overview per individual user.
The User Rights tab displays the names of all available users. If you have created a new Overview, each user has a check mark in the Default column. That means there are no rights. To set permissions:
- Click on the name of the user you want to assign rights to. An arrow appears in front of the name.
- Place a check mark in the column with the rights you want to assign to this user. The following rights are possible:
- no access
- consult
- edit
- Click the Save button to save the rights.
If you do not set any rights here, the rights of the user’s user profile, as set on the User Profile Rights tab, are used. If no link has been made on the User profile rights tab either, the user will not be granted any rights.
¶ Administrator Levels tab
If you want to give Administrator level management rights to an overview, you can indicate this on the Administrator levels tab. Two hyperlinks are visible on the tab: Linked administrator levels and Available administrator levels. Behind these hyperlinks is a number in brackets, which indicates how many levels are already linked and therefore have management rights and how many levels in total are available but do not yet have management rights. By clicking on a hyperlink, or by clicking on the arrow icon in front of the link, all Administrator levels from the relevant category are visible.
To link administrator levels:
- Click Available Administrator Levels.
- Check one or more levels.
- Click the Link items button next to Linked administrator levels.
- Click on Save in the toolbar.
To unlink an Administrator level:
- Click Associated Administrator Levels.
- Tick the level you want to disconnect. The line containing the name changes color.
- Click the Unlink items button next to Available administrator levels.
- Click on Save in the toolbar.
You can also establish a link by dragging an available administrator level to the linked levels. And by dragging a linked level to the available levels, you will unlink it.
¶ Excel overviews
In JOIN Admin you determine the values for reports that users can work with in JOIN Case & Document. One of the more advanced overviews is creating an Excel overview. The link between JOIN and Excel consists of the possibility to read data from reports that you define in JOIN Admin into Excel and process it in so-called “named ranges”. This means that the values coming from JOIN Admin are grouped by field so that users can edit them.
To create an Excel overview in the Admin Tool, a “normal” overview must first be created. This forms the basis of the Excel overview. How to create such an overview is described at the beginning of this chapter.
Using the link between JOIN and Excel requires some knowledge of Excel, as this knowledge is critical to a successful Excel report. You can, in principle, design any desired result yourself with the information that can be retrieved from JOIN.
¶ Create a new Excel overview
-
In the Navigation, select Overviews -> Excel overviews. The list of existing Excel overviews appears in the Center.
-
File: Excel Overview.png
-
Click on New Excel overview in the toolbar.
-
You can now record the data for the Excel overview. In the Name field, enter a name for the new Excel overview. Remember that this name must be recognizable for end users of JOIN Case & Document.
-
The File name field is automatically filled in.
-
You click on Add overview.
-
Select the overview you want to use for the Excel overview in the list that appears.
-
Place a check in front of the summary name and click Add summary. You can also add multiple overviews.
File: Add Overview.png
¶ User Profile Rights tab
On the User profile rights tab you can set the rights for the Excel overview. Determines what rights a user group has when using the selected overview.
The User Profile Rights tab displays the names of all available user profiles. If you have created a new Excel overview, there is a check mark in the Default column behind each user profile. That means there are no rights. To set permissions:
- Click on the name of the user profile to which you want to assign rights. An arrow appears in front of the name.
- Place a check mark in the column with the rights you want to assign to this user profile. The following rights are possible:
- Standard
- No access
- Consult
- edit
- Click the Save button to save the rights.
¶ User Rights tab
File: Tab User Rights4.png
On the User rights tab you can set the rights for the selected Excel overview per individual user.
The User Rights tab displays the names of all available users. If you have created a new Excel overview, there is a check mark next to each user in the Use profile column. That means there are no rights. To set permissions:
- Click on the name of the user you want to assign rights to. An arrow appears in front of the name.
- Place a check mark in the column with the rights you want to assign to this user. The following rights are possible:
- No access
- Consult
- edit
- Add
- remove
- Click the Save button to save the rights.
If you do not set any rights here, the rights of the user’s user profile, as set on the User Profile Rights tab, are used. If no link has been made on the User profile rights tab either, the user will not be granted any rights.
¶ Administrator Levels tab
If you want to give an Administrator level administrative rights to an Excel overview, you can indicate this on the Administrator levels tab. Two hyperlinks are visible on the tab: Linked administrator levels and Available administrator levels. Behind these hyperlinks is a number in brackets, which indicates how many levels are already linked and therefore have management rights and how many levels in total are available but do not yet have management rights. By clicking on a hyperlink, or by clicking on the arrow icon in front of the link, all Administrator levels from the relevant category are visible.
To link administrator levels:
- Click Available Administrator Levels.
- Check one or more levels.
- Click the Link items button next to Linked administrator levels.
- Click on Save in the toolbar.
To unlink an Administrator level:
- Click Associated Administrator Levels.
- Tick the level you want to disconnect. The line containing the name changes color.
- Click the Unlink items button next to Available administrator levels.
- Click on Save in the toolbar.
You can also establish a link by dragging an available administrator level to the linked levels. And by dragging a linked level to the available levels, you will unlink it.
¶ Design Excel overview
After the Excel overview has been created, you can design the report in Excel.
-
Click Edit Excel overview in the toolbar of the Center.
-
The overview is then transferred from JOIN Admin to Excel. Depending on the size of the report, this may take some time.
-
The exported files are saved in Excel under the Output sheet. Since this is a hidden sheet, you must unhide it before you can perform any operation. If you are working with MS Office Excel 2010 or 2007, then on the Home tab, in the Cells group, select the Format option. Then select Show and hide and double click Unhide sheet. You then choose Output and click OK.
If you are working with an earlier version of MS Office Excel, choose the Format -> Worksheet -> Make visible -> Output -> OK option. -
On the Output tab you will get the data from JOIN that you have just exported. You can now insert a new Excel worksheet on which you will design the overview.
-
For an Excel overview you use 3D references (the references on multiple worksheets). Below we give you an example of an Excel overview:
Example In this example we will create an Excel overview based on the number of information requests that four JOIN employees handled this week. Using the COUNTIF function in Excel we can count from a collection how many times a given value occurs.
The information requests are handled in this example by four people, namely:
- Bert Jansen
- Marco Klaassen
- Sander de Vries
- Alrik Peters
We use the COUNTIF function which has the following syntax:
COUNTIF ({range}, {string})
The name generated by the JOIN Excel wizard must be inserted in place of {range}. These names can be seen by choosing Formulas -> Use in formula in the menu. Then double-click on the desired name.
You will then be presented with a list of the field ranges in the following format:
Report_name_Field_name
In this case, “Information requests_Treatment by” must be used. For each name we will see how often it occurs in the list. So we insert the following four formulas into four cells, with the names in the cell before it:
-
Alrik
= COUNTIF (Information Requests_Treatment by, ”Alrik Peters”) -
Bert
= COUNTIF (Information requests_Treatment by, ”Bert Jansen”) -
Marco
= COUNTIF (Information Requests_Treatment Door, ”Marco Klaassen”) -
Sander
= COUNTIF (Information requests_Treatment by, ”Sander de Vries”)
In this case, this results in the table below:
| Alrik | 3 |
| Bert | 1 |
| Marco | 1 |
| Sander | 3 |
If then these cells (eight total) are selected and a graph is created, we can show a pie chart of them:
File: CIRKELDIAGRAM.png
- When you have designed the Excel overview as desired, select the Output worksheet and hide it. If you are working with MS Office Excel 2010 or 2007, then on the Home tab, in the Cells group, select the Format option. Then select Show and hide and double click Hide sheet. If you are working with an earlier version of MS Office Excel, choose the Format -> Worksheet -> Hide option.
- After this, save the Excel report. It is now ready for use in JOIN Case & Document.
¶ View Excel report from JOIN Admin
You can open the report you created in Excel from JOIN Admin.
- Click in the Navigation on Overviews management -> Excel overviews. The list of available overviews appears in the Center.
- Select the desired overview by clicking on the name in the list.
- Then click on Show Excel overview in the button bar.
- In the screen that appears, click on Show overview. You then have the choice between the file Open or Save.
- Every time you open the file, it is created with current data.
The end user can view an Excel overview from JOIN Case & Document, provided he has the correct rights.
¶ Organize overviews
It is possible that the list of available “regular” or Excel overviews is very long. To keep the list clear, you can organize it in groups.
- Choose Overview Manager -> Overviews in the Navigation or choose Overview Manager -> Excel overviews. The list of available overviews appears in the Center.
- Click on New group for (Excel) overviews in the toolbar of the Center.
- In the screen that appears you can enter a name for the new group. Click OK.
- In addition to the newly created group, you will now also see the Not classified group.
Next, you will group overviews by dragging:
- Click on the group Not classified. The overviews list is opened.
- Click the plus sign in front of the name of the overview that you want to place in the new group. Hold down the left mouse button.
- Now drag the overview to the new group you have created. A logo will appear when you perform the action.
- As soon as you release the left mouse button, the overview is placed in the new group.
- To remove the overview from the group, drag it back to the Not classified group.