When the user opens Fixi, the user finds his name at the top right.
When the user clicks on his name, he will find the dashboard under his name (provided that the permissions are enabled). The permissions for the dashboard can be given by someone with an admin account.
Below is an explanation of how the screen is constructed.
¶ Left frame
Via the left side, the user can use the following filters:
- Date
- Category
- Teams
- Practitioners
- Channel
Please note: the date always has the last 30 days selected. Do you want an overview of all notifications? Then select ‘all’ for the date.
By using the filters on the left side, the data on the right will change. After selecting a filter, wait a few seconds and you will see that the data will adjust to the right.
At the bottom of the left side you will find the option to download the dashboard to PDF.
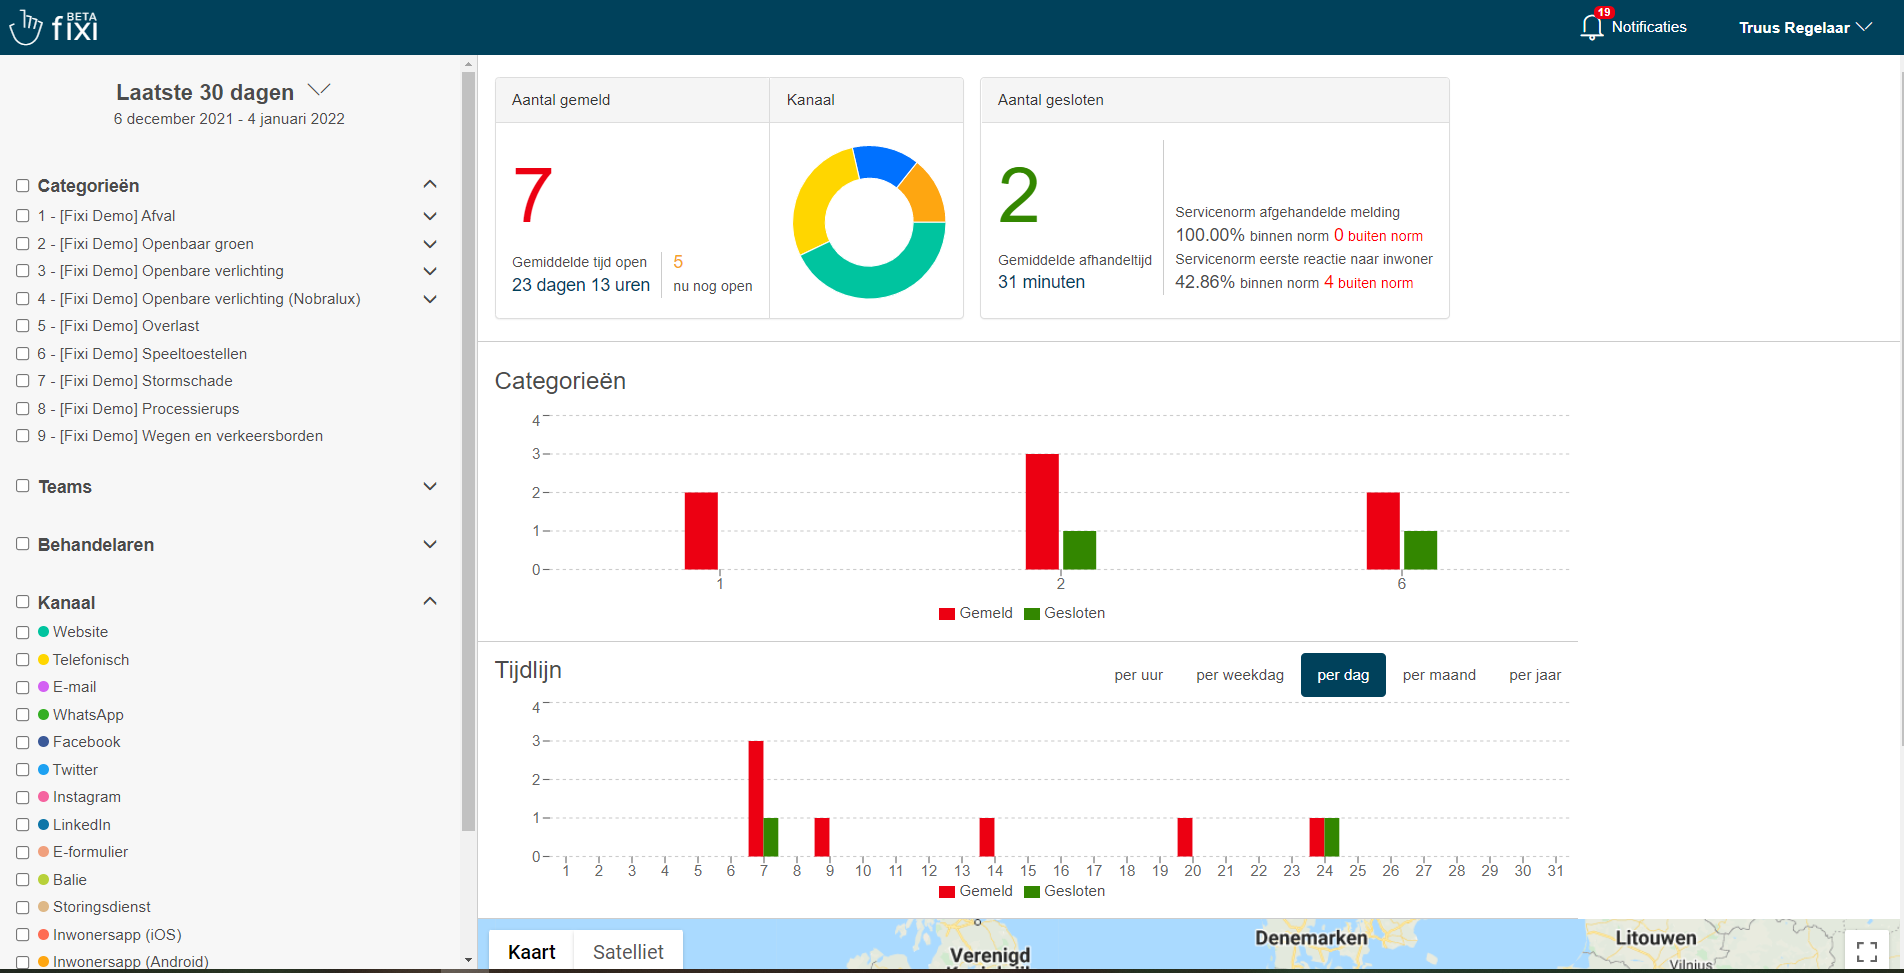
¶ Right frame
On the right side, the user can view the information.
The following is visible on the right side of the dashboard:
- Number reported and number closed
- Average time open and average handling time
- Service standards
- Division between categories
- Timeline
- Notifications on the map
¶ Number reported/closed
In the dashboard, a distinction is made between open notifications and closed notifications.
Open notifications:
All notifications with a status of reported, pending, hold, or forwarded.
Closed notifications:
All reports with a status of completed, rejected, or deleted.
¶ Average time open and average handling time
Average time open:
The duration that the report is registered up to and including the status ‘pending’, ‘hold’ or ‘forwarded’
Average handling time:
The average time of a report measured from the time of registration to the time of handling/rejection
¶ Service Standards
Service standard handled report:
Percentage of the number of reports within the handled standard. This standard is set per category or subcategory.
Service standard first response to resident:
Percentage of the number of reports within the first response standard. First response refers to the first response in the comment field and not the automatic email that Fixi sends.